The Distribution of QoC/QoT at the NCAA Level by Ryan Stimson is a fascinating look at the usage of NCAA hockey players.
The article begins with the research and calculations behind the understanding of Quality of Teammates and Quality of Competition in the NHL and then applies that to the NCAA.
In brief: The QOT experienced by a player varies much more than the QOC. The coach controls the first one absolutely and the other only partially, and then only if she chooses to line-match. Over the course of a season, QOC varies very little between most players. For this reason, claiming that "he plays against the tough competition, so it's okay he never scores," is thought to be mostly always wrong. In the NHL.
In the NCAA, as the research shows, the QOC varies much more widely than in the NHL and it lags behind the correspondingly wider variance in QOT by a proportionally smaller gap.
What this means is that how a coach uses a player and therefore who he plays against may have a more meaningful impact on his results in the NCAA. Stimson produced a tool to show any NCAA player you want for QOT or QOC. It uses estimated time on ice, so the numbers should be seen as not perfectly accurate.
I tackled one of the newest Toronto Maple Leaf prospects' points numbers in this look at Trevor Moore vs. some of the bigger names in the NCAA. Now we can look at both his QOT and QOC usage to see if we can learn anything else about him before he hits training camp in a few weeks.
I'll start with that thing the coach controls absolutely, the quality of teammates. Of course, the coach doesn't control the pool he has to draw from, college teams are much less designed than NHL teams are. But how a coach utilizes his players is revealed in QOT charts. Bear in mind, that Moore's team, the Denver Pioneers, went to the Frozen Four, so we can assume his coach has some smarts. (All images can be opened in full size by clicking on them, but you will leave this page.)
Because Moore is so far out on the leading edge of the x-axis, you can still see him if you look at the whole conference his team played in.
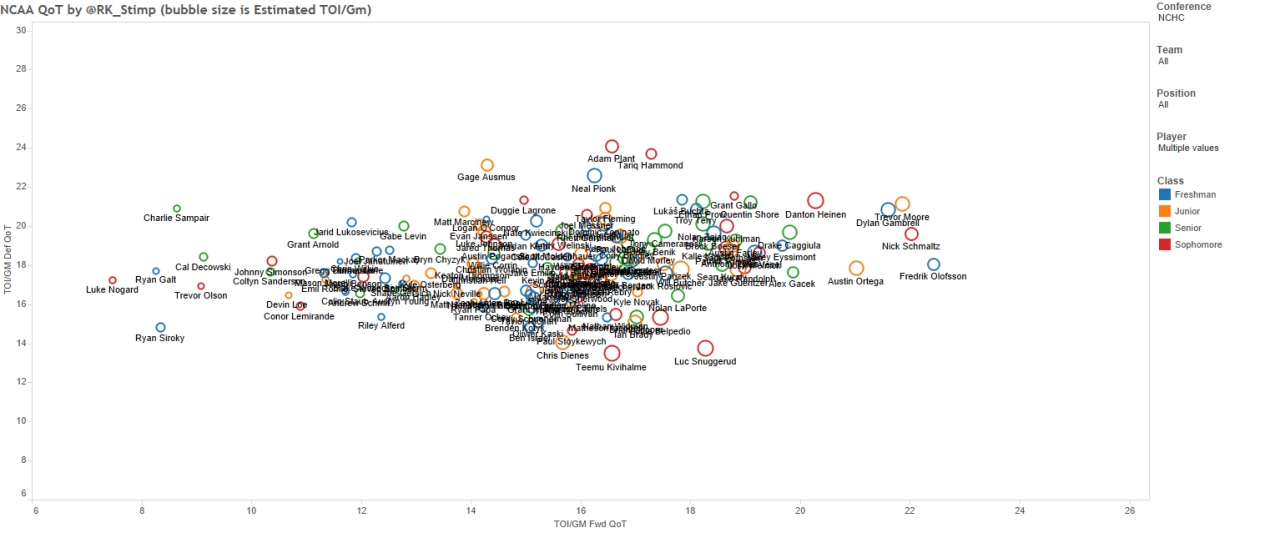
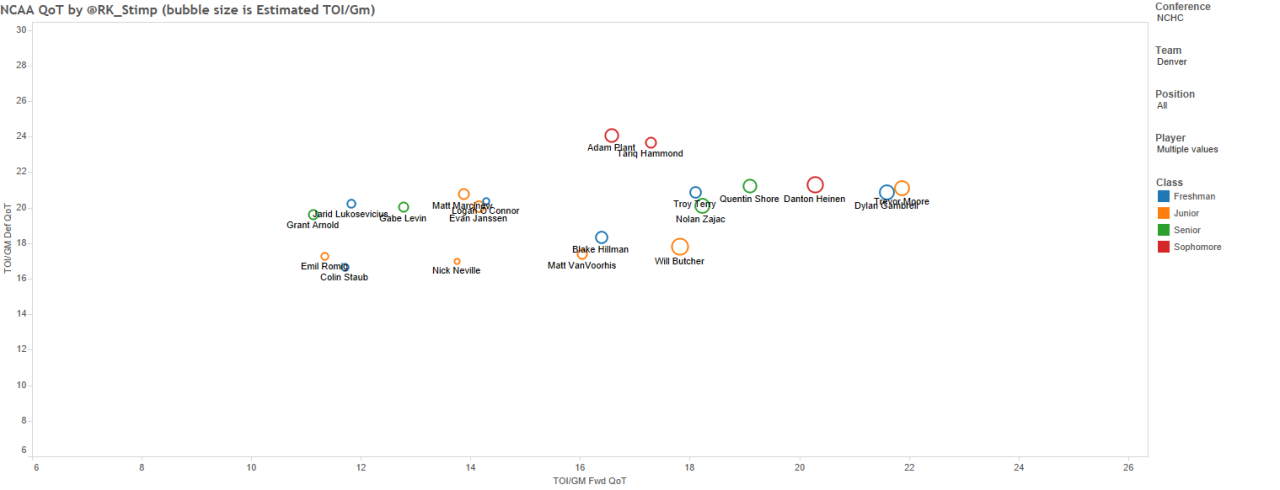
That x-axis shows the ice time of the forwards he plays with, and the y-axis is the defenders. The assumption is that coaches assign ice time by quality of player, so that the more you play, the better you are. We can likely safely assume that's broadly true but "better than whom" is a question we need to ask before we go inferring things from this chart.
In the Denver-only chart, you see Moore and his teammates. You see that only one player has a higher QOT. But don't assign some mental image of overall objective quality. Don't infer too much from that word. The 'whom' is only his other teammates. Even when you're looking at the full Conference of players, the teammates are still only his, and the "quality" of them is still only relative to his own team.
In the NHL, which is an elitist league that may not perfectly contain the 690 best skaters in the world at any one time but comes very close, the difference between one team's quality, in the larger sense of the word, and another's is not very large. Even the worst NHL team with the worst roster still has the Sedins on it, for example.
In the NCAA, we cannot assume that is the case.
We can see however that Moore played a lot of minutes, and Achariya's bio of him shows us that he was part of their all the eggs in one basket super line along with Dylan Gambrell and Danton Heinen.
We can see that on the team chart in how far out they all are on the x-axis. What we can now also see is they each played with the high minute players (each other), but the rest of the team is clustered more around the back end of the spectrum than the middle.
However, in terms of defensive support, Moore and the top line were on the ice with the middle quality of defenders. It isn't unusual to see a coach tuck his second or third pair of defenders behind a hot offensive line that can handle the play without the best support. Mike Babcock did that with Roman Polak and Martin Marincin fairly often.
It's tempting to look at a chart like this and say about Moore: oh, well, he was on the top line, so his points are all ride along gimmes. He's a passenger! But if this article were about Dylan Gambrell, you might be saying his stats are all down to his teammates, and the guy you'd be giving more credit to would be Moore! So that is not an inference it is safe to make looking just at this chart.
In all of the NCAA last year, Heinen was 12th in scoring, Gambrell was 14th and Moore was 24th. The next highest Denver player was 76th (Will Butcher, a defenceman) and no one else was in the top 100. Moore, as discussed by The Norris in my previous post, also had a poor shooting percentage last year.
Now, we can look at the Quality of Competition and see what that tells us.
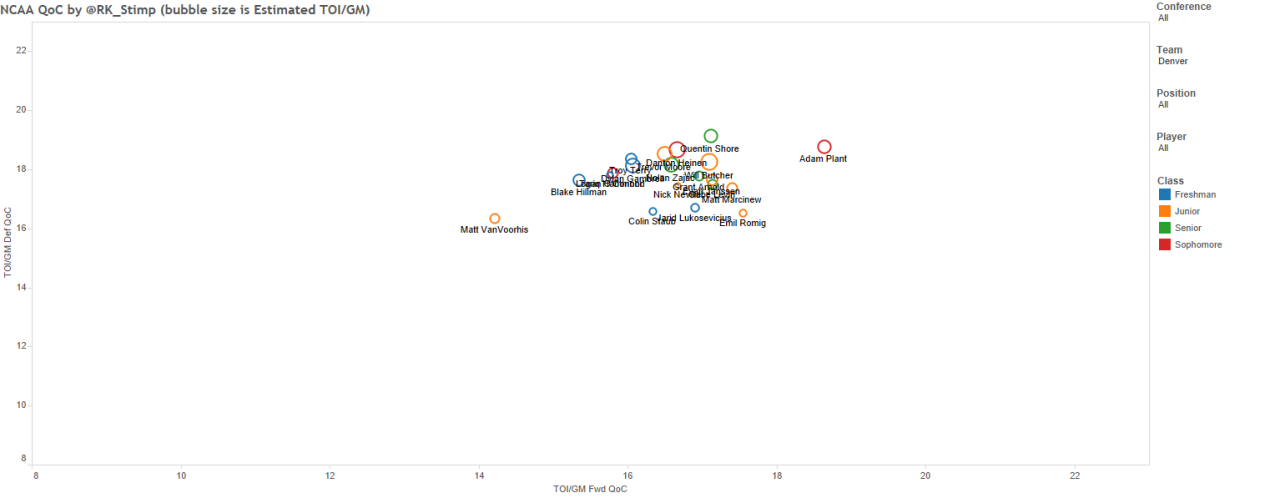
Moore and Heinen are the orange and red circles just by the Q in Quentin Shore.
We can see that in terms of forwards faced, the x-axis, they were solidly in the middle of the team, and the team shows very little variation. There is one guy who takes on a usage skewed towards top lines and top defenders, one at the opposite extreme, and the rest seem like they just roll over the boards in line order.
In terms of defenders faced, however, Moore and Heinen face almost as high quality a group as Shore does.
There is a strong temptation to start moralizing about players when we talk quality of competition. Words like "sheltered" and "tough minutes" lead us to think things about the character and value of a player that might not be valid. A high-scoring forward who is very skilled against other top lines is a very good player. But a high-scoring forward who is used against checking lines who tend to play fewer minutes is hardly a guy you toss aside with a sneer.
What we are seeing in this chart is primarily what the Denver coach thought of Moore, in relation to his teammates. The coach was stirring up a recipe to get the best results from what he had on hand, not playing fantasy hockey and choosing at will. So how should this information make us reevaluate Moore?
He played heavy time, he succeeded on the only scoring line on his team. They succeeded together well enough to take an overmatched team through the conference playoffs and into the Frozen Four. They didn't have the best defenders behind them, but they sure did face a lot of them.
At the end of all of this, I think Moore's uncharacteristically low shooting percentage last year mitigates what you can learn from his points more than his usage affects how I see him. He may find average QOC in the AHL to be one very tough levelling up from the NCAA, but he has proven the best defenders in the NCAA don't stop him.
I wonder more about what will happen to him when he is relied on less but has something more than a crowd of questionable players behind him on the depth chart. Will that free him up to do better? Will he get swamped into the crowd and fail to stand out?
But one thing keeps coming back to me. He was 21, in his junior year and undrafted, and he was the guy the coach put out on the ice more than almost anyone else. All the way to the Frozen Four.