
KEY TAKEAWAYS:
- Morgan Rielly and Jake Gardiner possess an impressive skillset that the team's other defencemen do not
- Cody Franson struggled considerably on zone entries last season
- Overall Toronto's defencemen make fairly minimal contributions to the team's zone entries relative to even some of the least-involved forwards
- Seriously though, Morgan Rielly
Last week I began my look at zone entries for the Toronto Maple Leafs by looking at how the forwards did through the first 46 games of the 2013-14 season. If you're not familiar with the concept of zone entries I'd recommend reading that piece first, since it explains what zone entries are and why we care about them. The short version is that neutral zone performance has a major impact in how much offence most NHL teams are able to generate, so looking at zone entries allows us to see which players are making the biggest contributions to their team's offence.
Defencemen have far fewer zone entries than forwards, so the information in this post tells us less about the overall offensive performance of the Leafs than the numbers for the forwards do. But there are still some very interesting differences between individual players, and we'll see that some Leafs defencemen contribute much more to helping the Leafs get the puck into the offensive zone than others.
Before we jump into the numbers, a couple of notes on the data:
- These stats cover the first 46 games of the 2013-14 season and all numbers are for 5v5 play only.
- There are only six defencemen here because there just wasn't much data for the others.
- Most of the data collection for this post was done by Corey Sznajder as part of his All Three Zones project.
Zone Entries As Percentages
| Player | # of entries | Control % | Entry Fail % | Dump % |
| Rielly | 83 | 47% | 9% | 53% |
| Gardiner | 97 | 37% | 16% | 63% |
| Phaneuf | 71 | 23% | 11% | 77% |
| Ranger | 45 | 18% | 11% | 82% |
| Gunnarsson | 64 | 14% | 10% | 86% |
| Franson | 69 | 13% | 25% | 87% |
Morgan Rielly's numbers here are pretty outstanding. Not only does he gain the zone with possession at a success rate that dwarfs other Leafs' defencemen, he does so with the lowest failure rate on the team. Rielly isn't at the level of Drew Doughty (60% controlled entry rate!) but his number is still very impressive. That he was this good during the first half of his 19 year old season impresses the hell out of me. His zone entry and exit stats suggest a guy who's going to be a very high end offensive player in the NHL.
Unsurprisingly, Jake Gardiner comes in 2nd in controlled entries by a pretty sizeable margin. He and Rielly look like the nexus of the Leafs' offence from the back end. They generate a lot of opportunities leaving the defensive zone and entering the offensive zone.
Phaneuf looks much better by this metric than he did on zone exits, settling nicely into the middle of the team.Whether settling nicely into the middle of the team on zone entries is something you want from a $7 million defenceman is an open question though. Based on the neutral zone data I've looked at so far, Phaneuf is not making the greatest contributions to the offence. How much of that is systems and role vs talent? I don't know. But it's something the Leafs should figure out.
Franson's numbers here are pretty surprising, especially from a guy often thought of as a puck-moving defenceman (albeit not the best skating one). Not only does he very rarely even attempt controlled zone entries, but he turns the puck over at the opposing blue line a lot. This is probably an area where his skating is hurting his results.
Zone Entry Rates Per 60 Minutes
| Player | # of entries | Entries/60 | Controlled Entries/60 | Failed Entries /60 |
| Rielly | 83 | 8.6 | 4.0 | 0.4 |
| Gardiner | 97 | 7.1 | 2.6 | 0.5 |
| Phaneuf | 71 | 5.6 | 1.3 | 0.2 |
| Ranger | 45 | 4.6 | 0.8 | 0.1 |
| Gunnarsson | 64 | 5.4 | 0.8 | 0.1 |
| Franson | 69 | 5.8 | 0.8 | 0.3 |
A couple of interesting things here. One is that Rielly's success rate relative to Gardiner's gives him a big boost in controlled entries. Both players are credited with a fairly high number of entries, but Rielly's get into the zone with control more frequently.
Rielly and Gardiner both have the greatest number of failed entries per 60 minutes of ice time, and I think this is an area where availability bias can creep into our judgement. As we saw above, Rielly is actually less likely than anyone else on the team to turn the puck over on any individual zone entry, but because he makes so many more attempts in general, it can leave the impression that he gives up the puck too often. Franson, who has a lower turnover rate than Rielly or Gardiner, is actually the riskier player on zone entries, but he has fewer failed entries because he makes so many fewer attempts.
One thing that we don't see in this data that I think would be illuminating is the breakdown of passes and carries on controlled entries. Because it was discovered that passes into the zone and carries into the zone both generated shots at the same rate, people who track zone entries stopped noting which was which, combing them into one "controlled entry" category. For the purpose of tying zone entries to shot generation that's fine, but when trying to figure out what contributions specific players are making (or where they're failing) it would be great to have that kind of breakdown.
For example, if we knew which entries were passes and which were carries, we could judge each player's skill set better. Is Morgan Rielly skating the puck into the zone a lot? Is Jake Gardiner making lots of good passes? If we knew what kinds of attempts Franson was making, we could get a better idea of whether his high failure rate is a problem of skating, bad passing, or maybe some combination of the two. Corey has done an incredible amount of work collecting this data so I'm certainly not blaming him, but for the kind of player-specific analysis that I find interesting, that more detailed breakdown would provide a lot of value. The same kind of thing could also be done with video scouting, but I'm without a Gamecenter subscription at the moment.
Chart Redux - Director's Cut
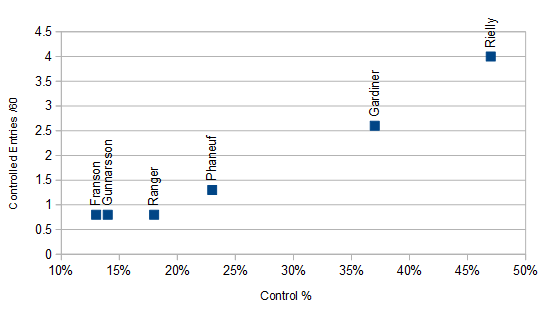
I produced this kind of chart for the forwards, so I thought it might be interesting to look at for the defencemen as well. This chart combines entry success % with the frequency of entries to give a better idea of how much each player is contributing to the offence through zone entries. I think it makes what I was talking about above more visually clear: Morgan Rielly is easily the Leafs' leader in zone entries on defence, and he and Jake Gardiner are carrying the play in a way that no one else on the defence is.
I don't want to overstate how much Rielly and Gardiner are contributing. While they are clear engines of offence on Toronto's defence, their entry rates are pretty low in comparison to the forwards. By way of comparison, Phil Kessel has 19 controlled entries per 60 minutes, nearly 5 controlled entries for every one Morgan Rielly makes. If Rielly was ranked with the forwards he'd be ahead of only Colton Orr and Frazer McLaren last year, and Gardiner would be ahead of just McLaren.
So it's important to keep in mind that, as impressive as Rielly and Gardiner are compared to the rest of the defence, their overall contribution to the team's zone entries is fairly small. But these stats do help highlight just how impressive the skillset that Rielly and Gardiner bring is.
Comment Navigation & Markdown
Navigation
cc to focus on comments section
c next comment
x previous comment
z next unread comment
Inline Styles
Bold: **Text**
Italics: *Text*
Both: ***Text***
Strikethrough: ~~Text~~
Code: `Text` used as sarcasm font at PPP
Spoiler: !!Text!!