
Last Thursday Chemmy wrote a post looking at the Maple Leafs' special teams play over the course of the season in individual games as well as on an ongoing basis. It's a seemingly simple concept for a post: the Leafs' PP and PK are getting worse as the season wears on and that is a bad thing. Of course, assuming that it's a simple concept presumes that you are not Steve Lansky. Who's Steve Lansky? Well, he's one of the other writers over at The Leafs Nation. Judging by his inability to follow simple logic he may be a close relative to Howard Berger. His reply is befitting someone that no doubt grew up eating paste during craft time: PP Success Means Nothing.
Considering his supposed background, it's no shock that he'd go the mittenstringer route. It's a tour de force! There's the suggestion that Chemmy said that a good powerplay was a guarantee of making the playoffs. I defy you to find it. There's misrepresenting that Chemmy's post was solely based on the powerplay and not the penalty kill. And then, to complete his ode to mittenstringery, he comes to a completely wrong-headed conclusion.
I don't think that it is a controversial statement to say that at a macro level that good special teams are generally a mark of playoff teams. A commonly used measure to gauge a team's special teams is to add up their powerplay effificiency and their penalty kill success rate. If it's over 100 that is good and if not then that is bad. Of course, as with any analysis it is imperative that you have the intelligence to understand that not everything is black and white. Sometimes teams with a good powerplay will be lousy five-on-five or brutal on the penalty kill and that can be enough to keep a team out of the playoffs.
In this post, I'll look at the five seasons since the lockout and examine the results with an eye towards a team's power play + penalty kill, their 5-on-5 results, and the net impact of their special teams. Follow me after the jump and ignore little Stevie and his dunce cap in the corner.
The graphs below will be very easy to read. The green boxes are playoff teams and the red ones are the outliers that I'll look at more in-depth.
Legend: PTS = Points, 5-5 F/A = Goals scored five-on-five divided by those allowed. 1.0 is a good mark, PP% = powerplay percentage. I said this would be easy., PK% = you guessed it, penalty kill percentage, PP+PK = It is accepted that anything over 100 is a good result, Net ST = This is the net number of goals that special teams contributed. I took (powerplay goals for minus shorthanded goals against) less (powerplay goals against minus shorthanded goals for) to arrive at this number.
2009-2010

For last season 13 of the 16 playoff teams had a special teams total of over 100. That figure includes the top five performers and eight of the top 10. As you can see by the table, while it's no guarantee of making the playoffs it does make it much more likely. What about the outliers?
- St. Louis suffered from a slow start to the season as well as playing the toughest division in the tougher conference.
- The New York Rangers missed the playoffs by a single point after dropping a shootout against the Philadelphia Flyers on the last day of the season. They only had the 16th best offence with 2.67 and had a goal differential of +5 so the net result was a bubble team.
- The Minnesota Wild were 22nd in total goals scored and 24th in 5-5 F/A. They just couldn't get it done in the most common game state.
- Philadelphia, Montreal, Boston, Detroit, and Ottawa were all outscored 5-5 F/A, some much more than others, but successful special teams were enough to get them into the playoffs. Ottawa especially heavily outperformed their abilities last year.
- Phoenix had the fifth best 5-5 F/A and Colorado was eighth. That was a big reason why they made the playoffs despite their special teams coming in a bit underneath the 100 threshold.
- Anaheim had the 5th best powerplay last year but was undone by their penalty kill. Their powerplay was 23rd in opportunities (300), allowed 9 shorthanded goals, and were eighth in net goals for (PPGF-SHGA). Their 24th ranked penalty kill faced the 7th most powerplays (324) and allowed the sixth most goals against. The net result was that the Ducks' special teams netted -5 goals for the team.
- Tampa Bay had the eighth best powerplay but got simply dummied at 5-5 F/A and had the 21st ranked penalty kill.
- The top ten 5-5 F/A teams made the playoffs. The 13th, 14th, 15th, and 16th ranked teams didn't make it because they were all Western conference teams and there were seven WC teams in the top 10. The eighth playoff team was Detroit with a +23 Net ST mark.
2008-2009
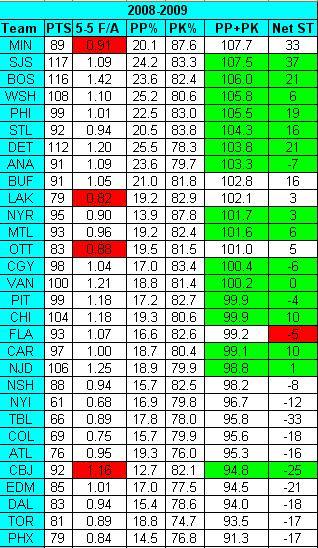
For last season 12 of the 16 top PP+PK teams made the playoffs. That figure includes seven of the top eight performers.
- Columbus was seventh in 5-5 F/A which made up for their weak special teams.
- Florida had a negative Net ST which means that despite having a positive 5-5 F/A mark that they missed the playoffs. Their powerplay was 24th ranked in the league and were 29th in powerplay opportunities.
- The Los Angeles Kings were 28th in 5-5 F/A.
- The Ottawa Senators were 26th in 5-5 F/A.
- The Minnesota Wild were 22nd in 5-5 F/A.
- Buffalo is just the unlucky team that highlights why there is no hard and fast 'guarantee'. By all rights they should have made the playoffs.
- Again, the top 10 5-5 F/A teams made the playoffs.
2007-2008
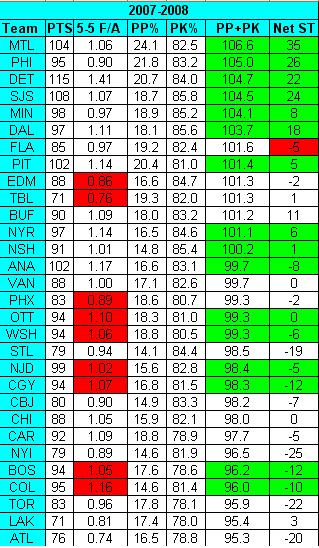
In this season, 10 of the top 16 PP+PK teams made the playoffs including the top six.
- The top seven 5-5 F/A teams and 13 of the top 16 made the playoffs.
- Of the teams that made the playoffs with sub-100 PP+PK they ranked the following in 5-5 F/A: Anaheim - 2, Colorado - 3, Ottawa - 7, Calgary - 11, Washington - 13, Boston - 15, New Jersey - 16.
- New Jersey had the fifth fewest powerplays in the league and had the fifth fewest powerplay opportunities which means they played more minutes at even strength, their strength, that compensated for their poor special teams.
- By that same measure, the Bruins had the fourth fewest powerplays and were shorthanded the seventh fewest times.
- Meanwhile, the Colorado Avalanche had the ninth fewest powerplays and were shorthanded the fewest times in the league.
- At the other end, Florida once again posted a negative Net ST figure.
- Phoenix, Edmonton, and Tampa came in at 25th, 27th, and 29th in 5-5 F/A respectively.
- Calgary and Buffalo (again!) highlight that these things are just indicators which is why no one's ever said one single marker is a guarantee for the playoffs.
2006-2007
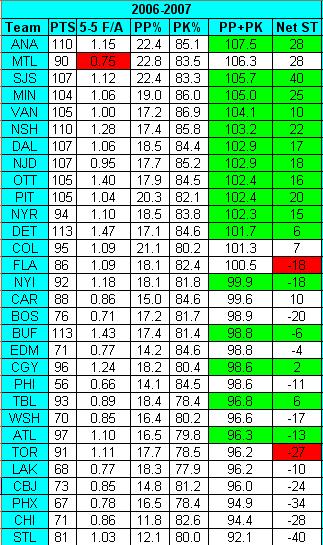
This season saw a return to form as 12 of the top 16 PP+PK teams made the playoffs including 11 of the top 12. There was even the first team to have a sub-100 PP+PK team with a sub 1.00 5-5 F/A team making the dance in the Tampa Bay Lightning. Of course, it doesn't come without a caveat. The Lightning had a 10-2 shootout record that allowed them to punch above their weight.
- 10 of the top 11 5-5 FA teams made the playoffs. The only one to miss were our very own Toronto Maple Leafs. Despite the strong even strength performance their powerplay was only 15th but the real crippler was their 27th ranked penalty kill. The net result was a -27 Net ST mark.
- Florida was derailed by their lack of discipline. They were shorthanded the second most times (443) which led to another year with a negative Net ST.
- Colorado, like Buffalo so often, was unlucky. Seven Western Conference teams had better PP+PK marks and Calgary's 5th highest 5-5 F/A tally was enough to get them past the Avalanche by a single point.
- New Jersey got past their sub-1.0 5-5 F/A with a strong Net ST which was good enough for seventh. A big part of their success was not just their strong penalty kill but also the fact that they were shorthanded the fewest times in the league (271). How disciplined were they? The next closest was 305 times, the closest one after was 330, and the average number of times a team was shorthanded was 398 times. It was especially important as their powerplay had the fourth fewest opportunities.
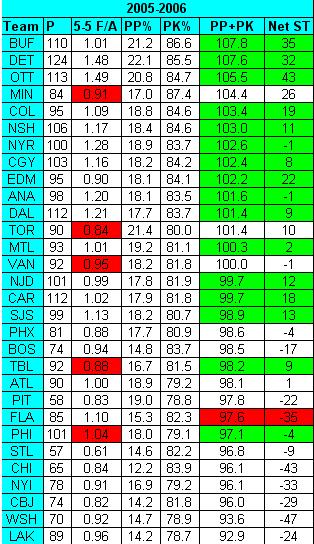
2005-2006
Comment Navigation & Markdown
Navigation
cc to focus on comments section
c next comment
x previous comment
z next unread comment
Inline Styles
Bold: **Text**
Italics: *Text*
Both: ***Text***
Strikethrough: ~~Text~~
Code: `Text` used as sarcasm font at PPP
Spoiler: !!Text!!