
The Alberta Analytics Conference was organized by Rob Vollman. If you haven't heard his name before you've definitely seen his work on my site, or his site, or extraskater. Yes, Rob Vollman invented Player Usage Charts, among many other new stats such as passes, quality starts, and more. He's also published a book.
But enough about Rob, let's talk about me. When Rob emailed me to ask if I would like to attend an analytics community get together in Calgary or Edmonton, I said sure. When he asked if I'd like to present something, I was honored at first, and then worried because I'd have to think of something to present. He shot down my first suggestion: watching Gardening With Greg videos and sharing gardening tips and tricks.
The Conference
Held on May 24, 2014, in Edmonton.
First there were Introductory remarks and introductory introductions of the attendees by Rob Vollman.
- Attendees:
- Some guy named Greg Sinclair
- Bruce McCurdy, Cult of Hockey blogger at The Edmonton Journal
- Rob Vollman, the organizer and MC
- Dan Haight, president of Darkhorse Analytics
- The programmer who re-did behindthenet.ca
- Twitter enthusiast @MacSapintosh
- Ryan Batty, blogger at coppernblue
- Justin Azavedo, blogger at Flames Nation
- Sean Solbak, the creator of hockey pool website Frozen Pools
- Rob Kerr, Calgary Flames broadcaster on Sportsnet 960
- Hockey fan @woodguy55
- Sunil Agnihotri, blogger at thesuperfan.ca
Hundreds of other cheering fans of hockey analytics- There were many more scheduled speakers and people who wanted to come but couldn't make it due to scheduling, family, and spending all day looking for Pokemon games at garage sale reasons.
The Presentations
Note: these recaps are going off memory so any errors in what transpired are due to my faulty recollections
Using Analytics in Hockey Pools by Sean Solbak
I missed most of this presentation but Sean developed some models to determine how much "luck" is contributing to a player's points total. If the player has been really lucky, use them as trade-bait in a deal with a less knowledgeable owner. Likewise, if the player has been unlucky, buy low on them and reap the benefits later on. Consider Kessel's slow start or Mark Fraser's crazy high on-ice shooting percentage last year - it's probably not going to last long term so you could make moves to acquire or get rid of these players. (Nonis did trade Fraser for a bag of pucks, not bad right?) I would have liked to see more aboot how Sean calculated luck, as there are other sites that do this. (According to that site Leafs were the third luckiest team last year and Colorado was the most luckiest this year)
Another point Sean brought up was to include other stats like giveaways and hits and quality starts in pools. We didn't think much of using real-time stats in pools because they're basically worthless but we did like the idea of using more interesting and predictive stats for goalies like Quality Starts. (My tip for picking a goalie is pick a bad goalie on a good team like Fleury or Niemi (or Quick lol) and they'll get you wins but you won't have to use a high pick on 'em)
Aside: Would you be interested in all-corsi hockey pool? I think this is a dumb idea. How would you do it? 0.1 points for Shot Attempt For, -0.2 points for Shot Attempt Against? Highest PDO wins?
Making Players Better With Micro Stats by Justin Azevedo
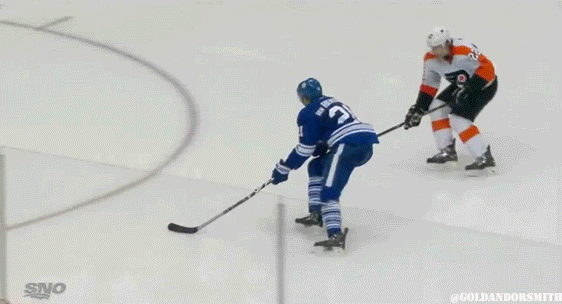
(click the image above for an animated gif demonstration of a "snow angel")
Justin spoke about how a player can know what their CORSI is but just knowing the number is not necessarily going to help them be a better player. So with an eye towards determining which plays result in which outcomes, Justin watched dozens of games, counting things like icings, snow angels, zone entries, etc. I would have liked to know what his results were for specific players but there were no cumulative stats presented - maybe there will be a Flames Nation post on this later.
One other interesting thing he spoke about was how a defenseman can get stuck on the ice because there isn't an opportunity to switch the player. This results in tired defense, more shots against, and more goals against. Instead, teams should use the roller hockey line change, summarized in this post.
Rob Kerr
Rob Kerr is a broadcaster with Sportsnet 960, and has worked at with all levels of hockey and forms of media. He is very interested by hockey analytics, and wanted to share his perspective on how new technology and ideas get adopted by hockey clubs. While living in Estevan, Saskatchewan, he was calling play by play for the Estevan Bruins of the Saskatchewan Junior Hockey League. He recounts how he wanted his family members to listen to his play by play online, and worked out a deal between the local internet company to get a local computer store to sponsor the broadcast. With this deal the Estevan Bruins were one of the first Junior Teams to have their games broadcast live online.
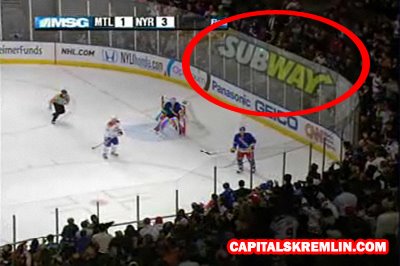
One of the points that Kerr stressed was that there is always a cost associated with new technology, and the usual way to recover that cost is through sponsorship. Those computer generated floating ads that appear on the glass in Sportsnet broadcast? They cost $250000 and Subway pays a lot to get their name there. If Sportsnet has that technology, then they at least have the technology to track zone time (just time how long the subway ad appears on each end of the ice) and could probably expand it to track players - but who will pay for that? Do you know any teams with a lot of money and an unused analytics budget?
I asked Kerr if he thought SportVU-style analysis would be coming to hockey. He agrees it will be, but is doubtful if it would be available to the average fan. Teams don't want to share their data with other teams, let alone the average joe hockey fan.
Kerr mentioned that the Flames use the PUCKS! system to break down game video into individual plays. If you wanted to say, watch Lundqvist's tendencies while stopping shots, you can query that and see a dozen videos of him facing similar shots. According to the PUCKS website 17 teams use their software. The Flames also have an analyst who uses his own proprietary formulas for proprietary reasons, but Kerr could not elaborate further because the Flames have become more tight-lipped about their analytics in recent years. Also depending on how much stock you put into Flames President of Hockey Operations Brian Burke's comments about hockey being an eyeball business, they may not even be using this analysis.
Kerr mentions that in the next couple years the format of the NHL's play by play report will be updated, to include things like offsides and icing information. This is because the teams themselves are parsing data out of this, and the data they get is only as accurate as what is on the sheet - and everyone and every team wants more and better data.
I also learned how the NHL tracks the shot and goal locations that Super Shot Search uses for data: 5 guys on laptops at pressbox level, at least in Calgary, work every game and diligently track every event. I would love to see how this data gets recorded live.
Greg Sinclair - NHL Shot Locations and Scoring Chances
I will have a separate post on what I researched and presented. You'll never believe what I found out!
Sunil Agnihotri - Hockey Analytics in Universites and Colleges
Sunil spoke about how to improve understanding and make progress in the field of hockey analytics by introducing it at the post-secondary level. It could make an ideal project for a Stats 101 course, to run linear regressions and find statistical significance in the data. I could also imagine some of the teachers at PPP teaching their students about Corsi or Fenwick.
The other thing Sunil stressed was that we need to have a sense of community and have open and shared data with everyone. He suggested that developers like me should open source our code and databases. There are at least two open source projects that can parse play by play and/or shot locations, and I'm pretty sure Tyler Dellow is using Muneeb Alam's open source code to do further analysis. I am hesitant to open source my code and data entirely though, for the following reasons:
- My code is buggy.
- Me and other developers I know have been hired by third parties to write code for them. Open sourcing could take away a revenue stream.
- If, say, http://www.extraskater.com open sourced itself, what would stop a dozen other imitators from creating their own versions? I know that http://www.hockeydb.com/ had the entirety of its data scraped and copied to a duplicate site, which is still online getting ad revenue off of someone else's hard work.
On the other hand, if I were to share my database or code maybe other people could come up with new and improved versions of Super Shot Search, say, a Super Duper Shot Search (and at least this way the site might have a new feature more than once every 2 years).
So, hockey stats developers, what's your take on this?
Dan Haight - Adoption of Analytics (by the Edmonton Oilers)
(click the above image to play the gif)
Dan is analyst from Darkhorse Analytics who works for the Edmonto Oilers. He spoke about how to have successful adoption of analytics, you need several components on your analytics team:
- the data butler - someone who can get the data
- the data explorer - someone who can dive into the data and find patterns and new discoveries
- the automaton - someone who can automate this process so new analyses can be produced in a timely fashion
- the champion - the person who bridges the gap between management and analytics guys, and promotes the cause/
(I think there was another component but I can't remember it) Dan mentions how a lot of management focuses only on the data butler or the automaton but not enough on the data explorer - you need to have the freedom to discover new things and take risks to create something of value.
Dan spoke about some of the hits, misses, and failures his analytics team had this season.
- Hit: Trading Magnus Paajarvi and a 2014 second-round draft pick for David Perron was a great move.
- Miss: Some player they drafted had a bad year because he was injured. I'm not sure you can call this a miss because no analytics or scout or any method can predict how someone will get injured in a hockey game.
- Failure: Devan Dubnyk. All the stats showed he should be at least average if not above average at stopping the puck. What happened?
Rob Vollman - Concluding Remarks
Rob concluded the conference by asking us questions about how we'd like to proceed with these kinds of conferences. We decided:
- We will have more conferences, hopefully one in September before the season starts
- They will be open to the public
- We need to have some sort of indexing of hockey analytics articles. This is a hard job but I notice that Josh Weissbock is doing it here and Arctic Ice Hockey has some references here. Garret Hohl mentioned he'd like to get an online database of these articles, but like everything, it's very time consuming./
This conference was a great way to meet people I had only spoken to online and build a sense of community. Why not come to the next conference in Alberta, or start your own?
Would you be interested in attending an Analytics Conference in your area?
| Heck yes. | 101 |
| No. | 13 |
| I don't like leaving my basement. | 34 |
Comment Navigation & Markdown
Navigation
cc to focus on comments section
c next comment
x previous comment
z next unread comment
Inline Styles
Bold: **Text**
Italics: *Text*
Both: ***Text***
Strikethrough: ~~Text~~
Code: `Text` used as sarcasm font at PPP
Spoiler: !!Text!!