

As of Sunday morning every team in the playoffs has played three games and all series are two games to one.
- Colorado over Seattle
- Minnesota over Dallas
- Vegas over Winnipeg
- LA over Edmonton
- Boston over Florida
- Toronto over Tampa Bay
- Carolina over New York Islanders
- New York Rangers over New Jersey
How do the Leafs measure up to the other 15, and one other in particular?
Special Teams
The Leafs have the fourth highest amount of five-on-five ice time at 160.75 minutes. Okay, actually they're tied with team number three who is, of course, the Tampa Bay Lightning and they have played an extra period of hockey. It's the Bruins and the Panthers spending more time on special teams with only 137.42 minutes at five-on-five.
In terms of power-play time, the Leafs and the Lighting are in the middle of the pack at eighth and seventh with 16.53 and 18.32 minutes respectively. Whatever you might think about referees being manipulated, it's not benefitting Tampa in any way as the two teams are almost evenly splitting the time with the man advantage.
The Hurricanes have 20 minutes of power-play time, and the yelling and whining and carrying on from the fans of the team literally everyone could have predicted would take a heap of penalties is predictable. The Panthers have the least, which means the Bruins are playing a clean game as they are known to do by all.
The Lightning lead in Expected Goals per 60 minutes on the power play with 13.6. The Leafs are fourth with 10.4. The Oilers and the Rangers are in between. Goals per 60 minutes are Oilers, Lightning, Stars, Leafs. In real goals, the Leafs and Lightning each have four on the power play.
Five-on-Five Results
What do you usually get with three games of results? No correlation between shotshare or Expected Goals and game outcomes, that's what. But it's worth looking at to see who is controlling the play and doing smart things with the puck.
The Fenwick % crown goes to the Oilers. If the first series lasted 15 games for everyone, that would become the Hurricanes, guaranteed, but right now, it's the Oilers with 62% and the puck on their sticks most of the time. (I'm using Fenwick or unblocked shots because it's the foundational shot metric of xG.) Next are the the Bruins and then the Lightning at 54% (better than their Corsi largely because the Leafs are not a big shot-blocking team). The Hurricanes are fourth, and the Leafs? They're way down at 14th, with 47%, much worse than their Corsi ranking. This is not ideal for the Leafs as a measure of overall game dominance.
Expected Goals take unblocked shots and weight them for shot type and location. No xG model accounts for pre-shot player movement, goalie movement, player skill, etc. etc. It's meant to show you the dull grey average outcome of zillions (accurate number) of shots of that type and from that location. The point is to adjust shotshare for quality, not to give the final answer on who deserves to win.
The Oilers lead here too with 61%. They shoot so much, it's hard for them not to lead as shot volume dominates xG results (maybe to a misleading degree sometimes). Next are the Avalanche, Panthers, Vegas and Islanders. Surprised? Carolina is notoriously good at shotshare, bad at xG.
The Leafs are seventh with 51%, totally flipping the bad Fenwick into a positive result in xG. The Lightning are 10th. This is the story of game 3 – the Lightning had the puck but shot from the point.
The Kings are the worst xG team with 39%, leading one to think the Oilers should have spent some money on a good goalie this summer or possibly got more than one good defenceman.
Real Goals, not Expected Goals
The Rangers are dummying the Devils with a GF% of 85 at five-0n-five. The other five-on-five winners at actual scoring are the Islanders, Wild, Vegas, Bruins, Kings, Kraken and the Maple Leafs. The Leafs are at a hair over 50% and the Lightning are a hair under. A hair is 0.06 of a percentage point.
All situations, the picture changes. The Leafs are fifth with 52% and the Lightning are 12th. This difference is entirely because of a couple of Leafs goals scored at six-on-five, which are counted neither as even-strength or the power play.
The Devils are at 25%, and you sure can't expect that to continue.
Goalies
All of the above is from Evolving Hockey, and now I'm switching to Moneypuck because it's easy.
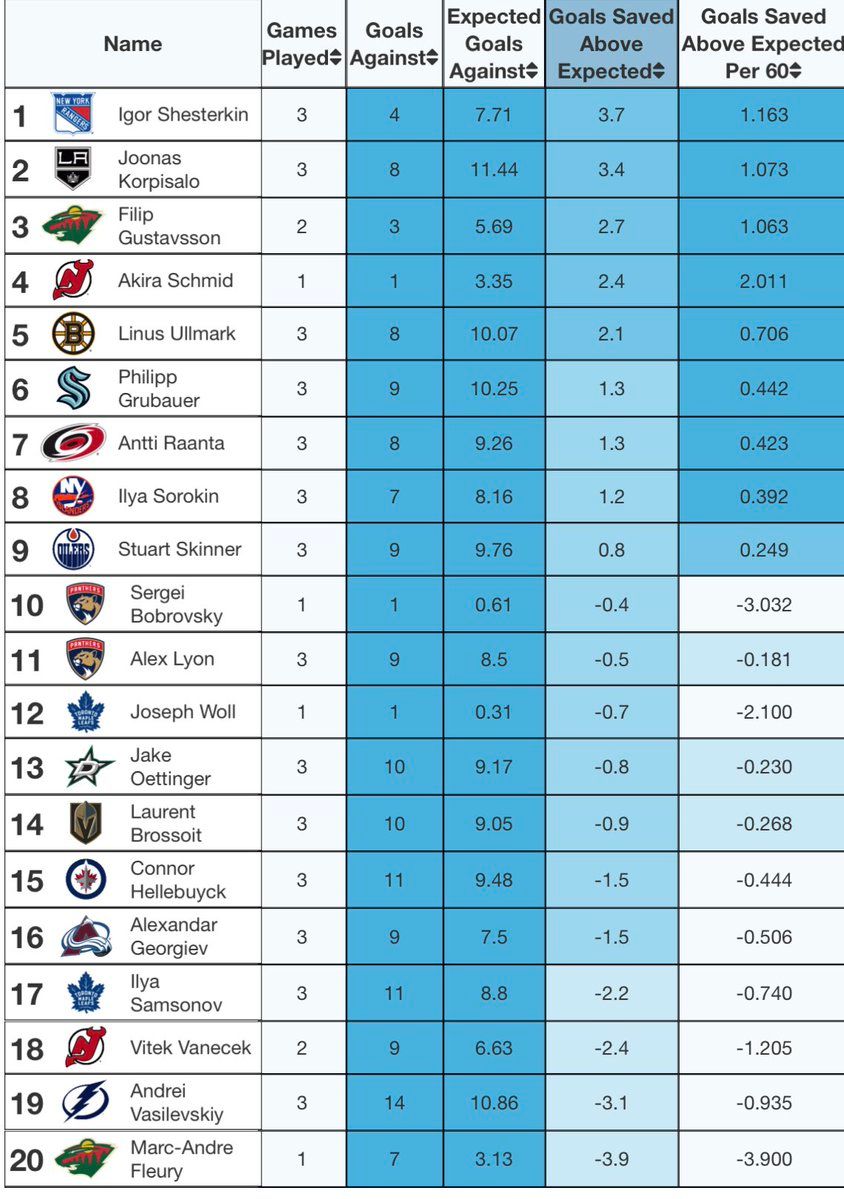
Vasilevskiy just hasn't been very good, and he's been less good than Ilya Samsonov. Most goalies in the early going are at best weakly above expected. Even Saint Linus is only merely good.
Points!
There are 165 skaters in the playoffs to date and, of those, 91 have no goals and 40 have no points. The most surprising (or funny) of the pointless are: Bo Horvat, Hampus Lindholm and Timo Meier.
Forget about them, let's talk about the leaders. Chris Kreider, unsurprisingly, leads in goal-scoring with five. Next are Adam Lowry and Roope Hintz with four. Three goals have been scored by Adrian Kempe, Jack Eichel, Leon Draisaitl, Mikko Rantanen and a fellow named John Tavares, who I've been told is bad, no good and should be traded so many times, it's become a thing people now say because they've heard it said. It's the "Hot enough for you?" of hockey talk.
Anthony Cirelli Leads the Lightning with two goals, a tally shared by a long list of some of the best scorers in the NHL.
Now, guess who leads in points? If you said Mitch Marner, you've been paying attention. He has eight, and the next closest are Draisaitl and Adam Fox with six. Matthews has five along with the (O')Rie(ei)lly brothers for the Leafs. The only major surprise here is that Dmitry Orlov is contributing more on the scoresheet than Hampus Lindholm for the Bruins.
Orlov and O'Reilly have to be the hottest deadline adds so far though. Oh, and Joonas Korpisalo.
And that's three games. Just don't expect the next three to look the same, and you won't be disappointed.


Comment Navigation & Markdown
Navigation
cc to focus on comments section
c next comment
x previous comment
z next unread comment
Inline Styles
Bold: **Text**
Italics: *Text*
Both: ***Text***
Strikethrough: ~~Text~~
Code: `Text` used as sarcasm font at PPP
Spoiler: !!Text!!