

As you may not know, judging by the recurring conversations about how you can't put chips in pucks, there are chips in all the pucks. And in the player equipment. This tracking technology produces NHL Edge stats, and a very carefully curated view of same is available on their website.
NHL teams have access to the raw data, and can and likely have made much use of it. One interesting sidenote on this is that there is only one chip in the shoulder area (I think in the pads) so that the data has to be processed to provide guesses about which way the player is facing at any given time. NFL tracking uses two chips to solve this problem.
Something else to consider is that a human body takes up more room than a chip, so it is only a general idea of where the player is, not a perfect one. If you want to see what visualized edge data looks like, try any gamesheet on NHL.com and look at the goal visualizer. I love that thing because there are times when I find the complex actions need repeated viewings. The GDT blame game is very often spectacularly wrong about the lead up to a goal against.
I also used Edge stats to get a handle on skating speed and very occasionally shot speed for the player profiles I did this summer. If you want time in the various zones for a player or a team as opposed to the use of Corsi to approximate it, then Edge gives you that too.
What it doesn't do at all on their site is contextualize the information beyond giving you percentile rankings. One area where this becomes absurd is with time spent in the neutral zone. How do you assign a value to that? And the problem of percentiles when the distribution is hidden and the max the min and the mean are mysteries is that you're left unknowing if you're seeing a meaningful difference or not.
This has been intentional, I believe, to keep the nasty public from freeriding off this information and turning it into something that does provide some context. You see, the NHL does not want to call out its own bad players. This is why Edge's percentiles obscure the bottom half into one bin of "below 50".
Every time I open up Edge to get the two or three things it provides that have any descriptive value, I keep hearing a song playing softly, "the stats the NHL gives you don't mean anything at all..." Well now there is a chance, a very slim chance, this might change.
 NHL Public Relations
Who is Sofascore? Maybe if you follow football (the one with the round ball) you'd know, because they seem to have more users on that part of their site. It is tilted European, and uses some fun football terms like "extra time" on the hockey pages, but it is at least interesting as it exists now.
The company is in Croatia, and has been in development and/or operating for about 15 years with a range of sports covered that is very extensive. There are other sites like this out there, things I've used when I want to know what's up with a prospect in some obscure tournament. They are almost entirely buggy ad-filled horror shows designed for gamblers. This site seems a little less inclined that way and it is much easier to use.
As of now, the NHL section has some interesting aspects to it. If you want to have a look, try the last Leafs game while you still remember it. It's visualizing some box score numbers, has a very, very useful shot plot that is quick and easy to convert to a given player or to subset by period. The only other sites that do this that I know of are, er, quaint in their web interface missteps.
According to that article, they plan to use the Edge data to produce xG and Goalie-specific xG (good luck!) and to present that as well as richer shot maps and something that sounds like one of the graphs HockeyViz invented.
Which is great, but I stubbed my toe on the fact they now show Corsi and Fenwick, but it's all-situations. And that just has no value. That's as useless as the shot clock on the TV. The only function it serves is to give the people who don't watch something to take note of and post about in GDTs.
So I am interested in what this site will produce, but only cautiously. It would be extremely easy to fill up a webpage with well designed information that's accurate and easy to use and still have it mean nothing at all. After all, the NHL has been doing it for years.
 TSN.ca Staff
 TSN.ca Staff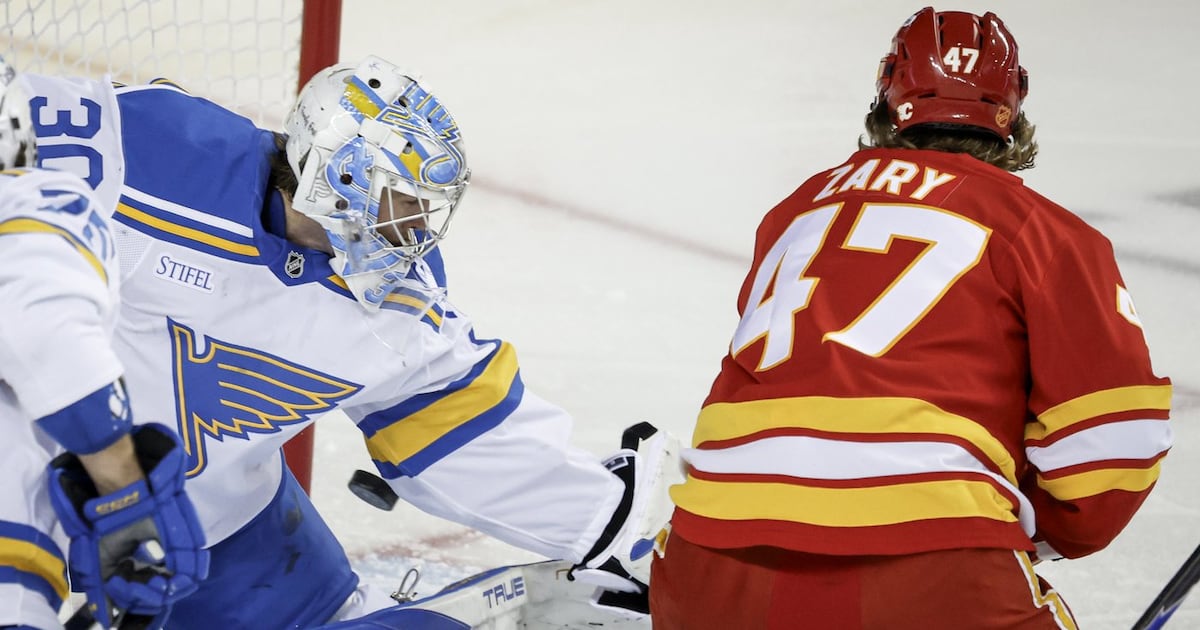
This guy, Connor Zary is the most boring replacement level player with no special skills I have ever looked up. He's a flatline on a chart, a zero on an all-in-one metric. He has a good shot and can score. So as a fourth liner, he would get enough ice time to score 12 or so goals. Maybe 15 on the third line. And otherwise he is just there.
And the Flames signed him for just under $3.775 million last summer for three years. When a team makes a misread like that on player value, they overreact and are more upset he's just blah than they would be otherwise.
They also might be hoping someone takes him (no one will take him). He's 25, he's not getting magically better.
In other news everyone has a piece out on the "second line struggles." Here's mine:
Today is game four of the regular season, and the Leafs are at home to the Predators. The preview will be out later.
Have a great day!


Comment Navigation & Markdown
Navigation
cc to focus on comments section
c next comment
x previous comment
z next unread comment
Inline Styles
Bold: **Text**
Italics: *Text*
Both: ***Text***
Strikethrough: ~~Text~~
Code: `Text` used as sarcasm font at PPP
Spoiler: !!Text!!