
[Note: Before I begin, I just want to say that most of the heavy lifting for this post was done by Corey Sznajder (@ShutdownLine) who is engaged in an insane effort to track zone exits and entries for all 30 NHL teams for the entire 2013-14 NHL season, which amounts to 1230 games. If you appreciate this post, you should go chip in to the All Three Zones project where Corey's raising a bit of money to support his work. I couldn't have written this post without hours of work from him.]
KEY TAKEAWAYS:
- Phil Kessel is fantastic at exiting the defensive zone with possession of the puck and his low turnover rate suggests that he isn't doing it by taking excessive risks
- Tyler Bozak very rarely plays the puck in the defensive zone and makes minimal contributions to the Leafs' attempts to enter the neutral zone
- The Toronto Maple Leafs seem to be deploying a defensive zone strategy that's systematically limiting the ability of their forwards to play the puck and exit the zone in control of it
- LOL Clarkson
Last week I wrote a post about the zone exits of Leafs defencemen through the first 46 games last season. This post will take a look at the same statistics, but this time I'm going to cover the forwards. While statistics like Corsi help us figure out who is contributing to puck possession in basic terms there are a number of confounding factors (such as linemates) limiting our ability to determine how much of a player's on-ice Corsi % that player himself is responsible for. Looking at more detailed, situational statistics like zone entries and exits are part of our attempt to gain a better understanding of what contributions particular players are making and where on the ice they're making them.
Tracking zone stats is a laborious process but thankfully I haven't had to do it myself. Corey Sznajder (@ShutdownLine) is responsible for most of the data presented in this post. I've tried to add some additional details and context beyond his raw numbers, so hopefully this all comes together into something that provides a unique look at some of the contributions Toronto forwards were making in the defensive zone last season.
And now - to the charts! (Note: All statistics in this post are for 5v5 play.)
EXITS AS PERCENTAGES
| Player | Exit% | Turnover% | Possession % | Carry% | Pass% | Other |
| Phil Kessel | 49.2% | 4.6% | 46.5% | 32.3% | 14.2% | 2.6% |
| James Van Riemsdyk | 46.1% | 6.2% | 43.5% | 23.2% | 20.3% | 2.6% |
| Jerry D'Amigo | 41.8% | 7.6% | 41.8% | 30.4% | 11.4% | 0.0% |
| Joffrey Lupul | 47.0% | 6.4% | 41.4% | 22.9% | 18.5% | 5.6% |
| Carter Ashton | 45.2% | 7.1% | 40.5% | 21.4% | 19.0% | 4.8% |
| Dave Bolland | 40.0% | 4.2% | 38.9% | 22.1% | 16.8% | 1.1% |
| Mason Raymond | 39.8% | 7.4% | 38.0% | 19.4% | 18.5% | 1.9% |
| Nikolai Kulemin | 42.1% | 5.3% | 36.8% | 23.4% | 13.5% | 5.3% |
| Nazem Kadri | 37.7% | 8.0% | 36.7% | 17.7% | 19.0% | 1.0% |
| Peter Holland | 35.8% | 10.8% | 33.1% | 14.2% | 18.9% | 2.7% |
| Jay McClement | 34.8% | 5.5% | 32.4% | 19.8% | 12.6% | 2.4% |
| Tyler Bozak | 32.9% | 7.0% | 30.1% | 9.1% | 21.0% | 2.8% |
| Colton Orr | 31.8% | 19.7% | 28.8% | 15.2% | 13.6% | 3.0% |
| David Clarkson | 32.3% | 7.0% | 27.8% | 18.4% | 9.5% | 4.4% |
| Frazer Mclaren | 30.3% | 6.1% | 21.2% | 15.2% | 6.1% | 9.1% |
So Phil Kessel is kinda really good. His percentage of exits where he carried the puck out of the zone with possession dwarf any of the other regular forwards (D'Amigo's stats here represent just a little over 100 minutes of time on ice, much lower than most of the others). And it doesn't look like Kessel is making those extra carries because he tries too many risky plays as his turnover % is just about the lowest among the team's forwards.
Kessel's linemate JVR is next best at exits. Tyler Bozak is well below them but I think in this instance it's worth noting that in general the centres have lower exit percentages than the wingers, which makes sense since wingers typically play closer to the blue line and should have an easier time getting the puck out.
That is unless you're Colton Orr or Frazer McLaren or David Clarkson. That's right, David Clarkson exited the offensive zone last year about as well as Colton Orr did. Although it's worth noting that Colton Orr turned the puck over one out of every five times he touched the puck in the defensive zone. I can't recall which of Claude Loiselle or Dave Poulin claimed that Orr was good at clearing the zone, but whoever it was I couldn't be happier that they're no longer with the team because Orr is miles worse in the defensive zone than anyone else on the team when it comes to turnovers. [Editor's Note: it was Greg Cronin]
Exits as raw percentages might give us a bit of an idea about efficiency, but I think it's when we look at zone exits per 60 minutes that things start to get really interesting.
EXIT RATES PER 60 MINUTES
| Player | Exits/60 | Touches/60 | TO/60 |
| Jerry D'Amigo | 15.88 | 38.01 | 2.89 |
| Phil Kessel | 11.65 | 25.03 | 1.16 |
| Mason Raymond | 11.64 | 30.65 | 2.27 |
| James Van Riemsdyk | 11.60 | 26.68 | 1.66 |
| Peter Holland | 11.54 | 34.85 | 3.77 |
| Dave Bolland | 11.27 | 28.93 | 1.22 |
| Joffrey Lupul | 11.25 | 27.19 | 1.75 |
| Nazem Kadri | 10.62 | 28.97 | 2.32 |
| Jay McClement | 10.02 | 30.91 | 1.69 |
| Nikolai Kulemin | 8.43 | 22.88 | 1.20 |
| Carter Ashton | 7.54 | 18.63 | 1.33 |
| Tyler Bozak | 7.33 | 24.39 | 1.71 |
| Colton Orr | 5.74 | 19.93 | 3.93 |
| David Clarkson | 5.51 | 19.78 | 1.38 |
| Frazer Mclaren | 4.46 | 21.04 | 1.28 |
(TO = turnovers)
The thing that jumps out most obviously here to me is David Clarkson, who is just an absolute train wreck. His numbers are comparable to Colton Orr and Frazer McLaren, two of the worst players in the entire NHL last season. What we're seeing here lines up perfectly with the eye test. Not only did Clarkson look bad last year, but as far as zone exits go, he really, really was.
You may have noticed that Tyler Bozak was not much better. Part of the problem is that the entire Kessel/Bozak/JVR line has such a low rate of touches, and it's not entirely clear from this data who is responsible for that. That said, Bozak does have the worst numbers on that line both in terms of the number of puck touches and the rate of exits. It's worth noting that the team's other centres do not have lower touch rates than their primary linemates. For example, McClement has a significantly higher rate of touches than Kulemin, and Kadri is a bit higher than Lupul. Bozak just doesn't appear to play the puck very often. Which isn't something you want to hear about your #1 centre.
Peter Holland and Jerry D'Amigo both have numbers that look pretty impressive here, but their ice time was among the lowest of any of the players listed here, so I suspect much of their apparent impressiveness is actually a quirk of their small sample size.
Something Strange About Toronto Forwards
In my post on zone exits for Leafs defencemen I produced a series of four charts showing the correlations between touches, exits, and shot attempts for and against. I will now produce the same four charts for the forwards.
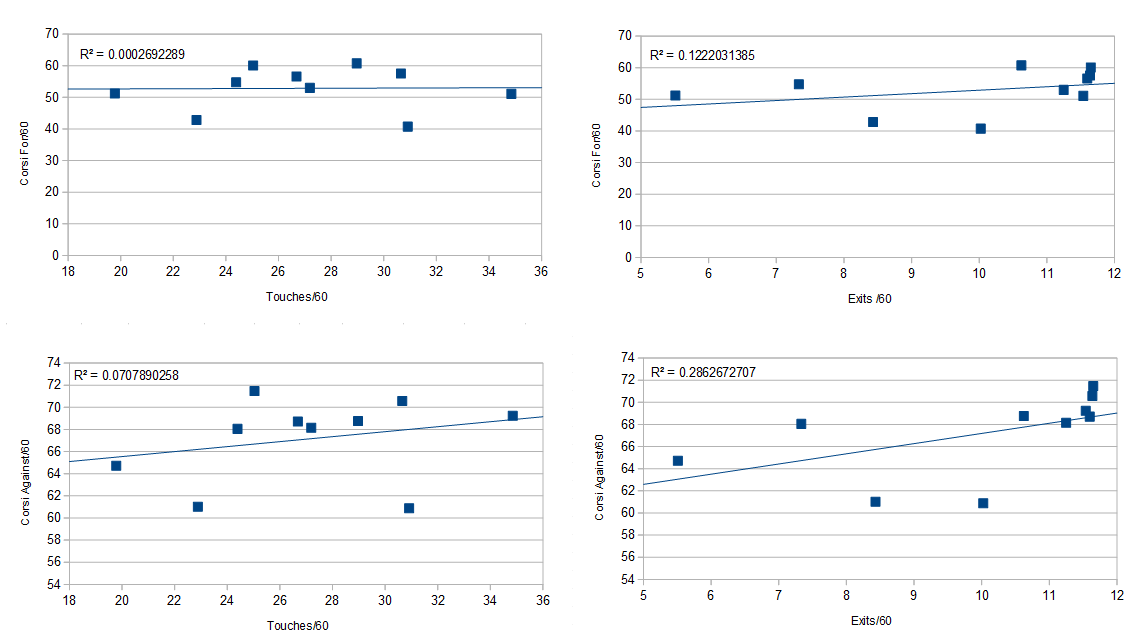
(click to zoom)
If you read the post on defencemen, you'll notice something in these charts - the strong correlation that existed between exits and CF/60 for defencemen has all but vanished for forwards. And there's a reason for that: the bulk of Toronto forwards had exit rates that cluster very strongly around 10-11 exits per 60 minutes (I included only forwards with at least 250 minutes of 5v5 TOI here). That struck me as odd. Shouldn't there be some kind of discernible difference in skill here? There certainly was for the defencemen.
There aren't a whole lot of posts out there right now on zone exits, but I did manage to find one data set that I could use as a comparison to the 2013-14 Leafs, and that was the 2012-13 Oilers. Bruce McCurdy of the Edmonton Journal has helpfully posted the 2012-13 Oilers zone exit numbers, and rather conveniently for me his spreadsheet included ice time. Also conveniently, the 2012-13 season was nearly the same length as the number of games I'm covering in this post (48 vs 46) so the sample size is very close. Yet another convenient angle here is that the 2012-13 Oilers were a dreadful possession squad, so we're comparing two similar teams.
What I found for the Oilers is that their forwards had a wide array of zone exit rates and that the range roughly matched what you saw from their defencemen. Some were very bad (below 10 exits per 60) but some were also very good (as high as 20 exits per 60). One important detail that I noticed is that the Oilers' top two centres (Ryan Nugent-Hopkins and Sam Gagner) had among the team's highest exit rates. So in the case of the 2012-13 Oilers, being a centre was not a sign that you were likely to have trouble exiting the zone.
This leads me to believe that the Leafs had a systematic issue last year (at least in the first 46 games) that was leading to zone exits for forwards being significantly suppressed, especially for their centres. I've personally spent a lot of time complaining about their breakouts and the way Randy Carlyle has his forwards playing far too deep in the defensive zone, and this is the first really good evidence that we have that the strategy is hurting the team. As with David Clarkson, this is an instance where the data does a good job of providing support for what we've observed while watching. I think this is pretty strong evidence that the Leafs need to revamp their defensive zone scheme this year so that the forwards are not being systematically held back from exiting the zone with possession.


Comment Navigation & Markdown
Navigation
cc to focus on comments section
c next comment
x previous comment
z next unread comment
Inline Styles
Bold: **Text**
Italics: *Text*
Both: ***Text***
Strikethrough: ~~Text~~
Code: `Text` used as sarcasm font at PPP
Spoiler: !!Text!!