

There's a report that the Leafs and Laurent Brossoit like each other. And instead of doing an article Report: Leafs and Brossoit like each other, I thought I'd just dive in and look at goalies. Not just Brossoit, because if I just tell you his numbers or his rankings in those numbers on a list of goalies, you really don't have the full picture of where on the distribution of results he falls.
Rulers
I don't use save % for NHL goalies because there is simply no reason to. NHL GMs likely do for the most part. I do use all-situation information for goalies because there's no gain in understanding by limiting it to five-on-five.
I'm going to use two methods today:
GSAX
GSAX stands for Goals Saved Above Expected, so you need to know that while Expected Goals are arrived at by weighting unblocked shots for various things like location and type, the end result is expressed as Goals that are Expected. Expected doesn't mean, "I expect you to get at least 95% on your test, young lady," rather it means, "An average student on an average day facing an average test maker would be expected to get 60%, so you had better top that, young lady."
Once you have the Expected Goals, you just compare them to the real ones and you have GSAX.
Delta Save % aka that really horrible acronym stat
The real name of this is xFSv% or Expected Fenwick Save %. So what all that means is that given the unblocked shots (Fenwick) converted to expected goals, what is the save % an average goalie would get. Delta just means difference, and it simply means the actual Fenwick Save % minus the Expected.
In both cases zero is right on expected, and positive is good.
Goalies
I used Evolving Hockey and the last five seasons combined, and I picked a filter out of the air to give me a decent sample – so no one-hit wonders – and I chose 1,500 FA which happily just got me Joe Woll in the list. There are actually only 98 goalies and by removing all the ones who are retired, out of the NHL, or on trial, I get 76.
Measuring
You're forgiven if you think those two "rulers" I chose are the same thing since they both use Expected Goals. They aren't, and let's look at the difference, which is workload, both in games played and in shots faced.
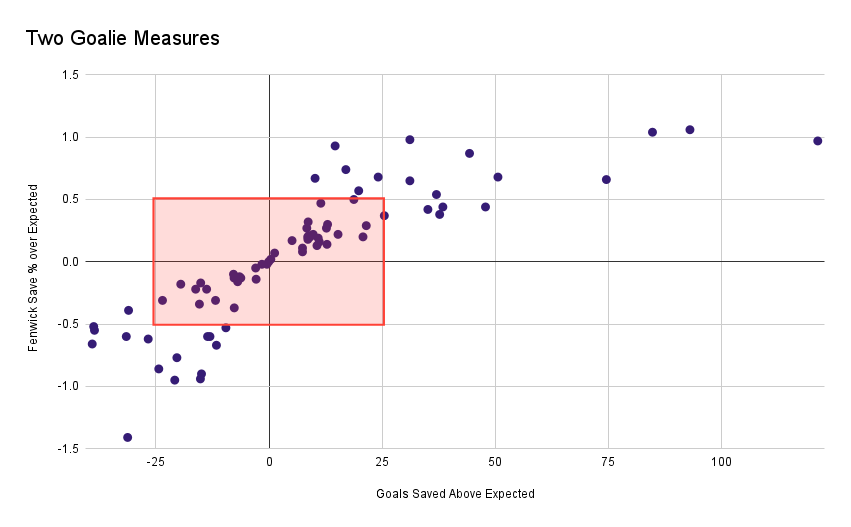
Clearly they are strongly related, but at the top end you see those four lonely souls out by themselves. That's big workload goalies, the ones who start more games than they should and whose teams let them face a lot of shots. From right to left, they are Connor Hellebuyck, Igor Shesterkin, Ilya Sorokin and Juuse Saros.
You can also see that if you just look at the either side of zero results in the red box that that's most of the dots. There's more results in this set better than the red box than worse because you don't usually last for 1,500 FA if you're hopeless. In an NHL season, you'll usually see that distribution a little differently.
Delta Save % or Fenwick over Expected is what I usually focus on now that the Leafs are not a terrible team for allowing shots. They don't need a goalie who can start 50 games and face 50 a night. This is the distribution of just the Delta measure:
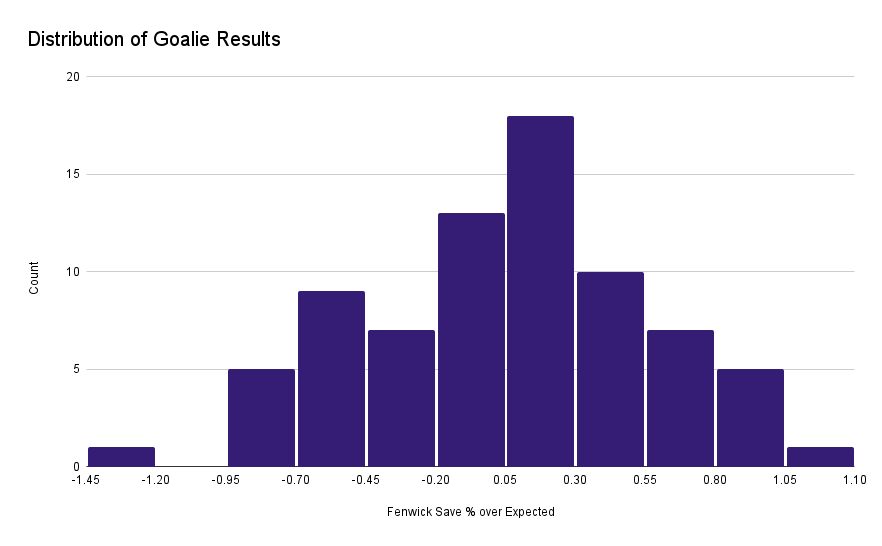
Let's say you aren't interested in either side of zero. You just want a guy over zero. The first two bars that go up to 0.55 account for 30 of the 76 goalies. This should be mostly backups, but goalies are not distributed with the 32 best as starters and the next 32 at backups. Which is how a team can have a starter who is backup quality, or putting up backup results.
The top three bars account for 13 goalies. And both Joe Woll and Laurent Brossoit are in that group. Brossoit has 91 games and 3,446 FA, Woll has 36 and 1,569. These small runs of games spread over multiple season is the type of goalie results where you get believers, and people who want to believe but know they shouldn't. But it's very easy to understand why Brossoit wants a job where he gets to play more than the 23 games he got in this season.
One caveat on Brossoit as a free agent: He's a buy high investment since he was fifth in Delta Save % for goalies who played at least as much as Frederik Andersen. Andersen was first.
Do you want the whole list? Why not.
| Player | Season | Team | GP | TOI | FA | FSv% | xFSv% | dFSv% | GSAx |
|---|---|---|---|---|---|---|---|---|---|
| Igor Shesterkin | 19-24 | NYR | 213 | 12427 | 8760.37 | 94.24 | 93.18 | 1.06 | 93.01 |
| Ilya Sorokin | 20-24 | NYI | 192 | 11257.11 | 8178.97 | 94.24 | 93.2 | 1.04 | 84.73 |
| Anthony Stolarz | 19-24 | ANA/FLA | 83 | 4355.77 | 3176.12 | 94.1 | 93.12 | 0.98 | 31.12 |
| Connor Hellebuyck | 19-24 | WPG | 293 | 17120.17 | 12454.5 | 94.01 | 93.04 | 0.97 | 121.26 |
| Joseph Woll | 21-24 | TOR | 36 | 2127.98 | 1568.94 | 93.73 | 92.8 | 0.93 | 14.6 |
| Jeremy Swayman | 20-24 | BOS | 132 | 7570.71 | 5099.32 | 94.25 | 93.38 | 0.87 | 44.3 |
| Pyotr Kochetkov | 21-24 | CAR | 69 | 3924 | 2301.25 | 93.35 | 92.61 | 0.74 | 16.97 |
| Connor Ingram | 21-24 | NSH/ARI | 80 | 4567.35 | 3570.74 | 93.41 | 92.73 | 0.68 | 24.11 |
| Linus Ullmark | 19-24 | BUF/BOS | 185 | 10755.55 | 7472.9 | 94.31 | 93.63 | 0.68 | 50.58 |
| Joel Hofer | 21-24 | STL | 38 | 2063 | 1511.82 | 93.66 | 92.98 | 0.67 | 10.17 |
| Juuse Saros | 19-24 | NSH | 271 | 15594.94 | 11366.66 | 93.88 | 93.22 | 0.66 | 74.54 |
| Stuart Skinner | 20-24 | EDM | 123 | 7058.13 | 4791.28 | 93.4 | 92.75 | 0.65 | 31.12 |
| Laurent Brossoit | 19-24 | WPG/VGK | 91 | 5000.49 | 3449.52 | 93.82 | 93.24 | 0.57 | 19.81 |
| Semyon Varlamov | 19-24 | NYI | 163 | 9353.12 | 6795.35 | 94.14 | 93.6 | 0.54 | 36.99 |
| Charlie Lindgren | 19-24 | MTL/STL WSH |
92 | 5151.72 | 3724.34 | 93.57 | 93.07 | 0.5 | 18.74 |
| Chris Driedger | 19-24 | FLA/SEA | 64 | 3602.25 | 2426.01 | 94 | 93.52 | 0.47 | 11.44 |
| Thatcher Demko | 19-24 | VAN | 209 | 12210.68 | 8791.63 | 93.56 | 93.12 | 0.44 | 38.41 |
| Andrei Vasilevskiy | 19-24 | T.B | 269 | 16065.56 | 10874.4 | 93.68 | 93.24 | 0.44 | 47.83 |
| Darcy Kuemper | 19-24 | ARI/COL WSH |
203 | 11649.08 | 8399.62 | 93.73 | 93.32 | 0.42 | 35.1 |
| Jacob Markstrom | 19-24 | VAN/CGY | 256 | 14997.59 | 10029.76 | 93.37 | 92.99 | 0.38 | 37.7 |
| Frederik Andersen | 19-24 | TOR/CAR | 178 | 10394.9 | 6811.24 | 93.65 | 93.27 | 0.37 | 25.47 |
| Joey Daccord | 20-24 | OTT/SEA | 68 | 3777.5 | 2739.15 | 93.73 | 93.42 | 0.32 | 8.64 |
| Casey Desmith | 20-24 | PIT/VAN | 113 | 6279.9 | 4351 | 93.13 | 92.83 | 0.3 | 12.93 |
| Jake Oettinger | 20-24 | DAL | 193 | 11041.19 | 7486.55 | 93.83 | 93.54 | 0.29 | 21.48 |
| Alex Lyon | 19-24 | PHI/CAR FLA/DET |
70 | 3974.32 | 3036.59 | 93.33 | 93.05 | 0.27 | 8.34 |
| Filip Gustavsson | 20-24 | OTT/MIN | 111 | 6356.6 | 4668.81 | 93.75 | 93.48 | 0.27 | 12.68 |
| Petr Mrazek | 19-24 | CAR/TOR CHI |
167 | 9351.85 | 6858.02 | 93.01 | 92.79 | 0.22 | 15.24 |
| Antti Raanta | 19-24 | ARI/CAR | 124 | 6844.76 | 4531.12 | 93.38 | 93.16 | 0.22 | 9.75 |
| Logan Thompson | 20-24 | VGK | 103 | 5922.82 | 4134.05 | 93.68 | 93.47 | 0.21 | 8.8 |
| Anton Forsberg | 19-24 | CAR/OTT | 115 | 6204.62 | 4619.23 | 93.1 | 92.9 | 0.2 | 9.09 |
| Ukko-Pekka Luukkonen | 20-24 | BUF | 100 | 5711.22 | 4194.78 | 93.22 | 93.02 | 0.2 | 8.54 |
| Jordan Binnington | 19-24 | STL | 247 | 14346.88 | 10380.3 | 93.29 | 93.09 | 0.2 | 20.76 |
| Sam Montembeault | 19-24 | FLA/MTL | 133 | 7405.7 | 5865.8 | 92.8 | 92.62 | 0.19 | 10.86 |
| Adin Hill | 19-24 | ARI/S.J VGK |
119 | 6482.34 | 4657.97 | 93.84 | 93.66 | 0.18 | 8.58 |
| Lukas Dostal | 21-24 | ANA | 67 | 3586.99 | 3041.35 | 93.22 | 93.05 | 0.17 | 5.08 |
| James Reimer | 19-24 | CAR/S.J DET |
163 | 9271.78 | 6845.88 | 93.22 | 93.05 | 0.16 | 11.1 |
| Tristan Jarry | 19-24 | PIT | 228 | 12913.69 | 9006.49 | 93.58 | 93.43 | 0.14 | 12.8 |
| Alexandar Georgiev | 19-24 | NYR/COL | 211 | 11950.04 | 8367.01 | 93.26 | 93.13 | 0.13 | 10.59 |
| Jake Allen | 19-24 | STL/MTL N.J |
164 | 9426.62 | 6971.91 | 92.9 | 92.79 | 0.11 | 7.39 |
| Sergei Bobrovsky | 19-24 | FLA | 243 | 13950.56 | 9463.59 | 93.05 | 92.97 | 0.08 | 7.39 |
| Pheonix Copley | 21-24 | WSH/L.A | 47 | 2622.33 | 1698.43 | 92.93 | 92.86 | 0.07 | 1.23 |
| Samuel Ersson | 22-24 | PHI | 63 | 3454.39 | 2277.96 | 92.76 | 92.74 | 0.02 | 0.39 |
| Jonathan Quick | 19-24 | L.A/VGK NYR |
178 | 10237.56 | 7007.04 | 93.03 | 93.03 | 0 | -0.09 |
| Eric Comrie | 19-24 | DET/N.J WPG/BUF |
52 | 2842.95 | 2083.5 | 92.49 | 92.51 | -0.02 | -0.47 |
| Ilya Samsonov | 19-24 | WSH/TOR | 171 | 9641.72 | 6516.6 | 93.23 | 93.25 | -0.02 | -1.58 |
| Ville Husso | 20-24 | STL/DET | 132 | 7491.25 | 5457.08 | 93.06 | 93.11 | -0.05 | -2.96 |
| Cam Talbot | 19-24 | CGY/MIN OTT/L.A |
198 | 11323.6 | 7906.52 | 93.58 | 93.68 | -0.1 | -7.86 |
| Alex Nedeljkovic | 19-24 | CAR/DET PIT |
139 | 7732.25 | 5616.87 | 93.15 | 93.26 | -0.12 | -6.54 |
| Vitek Vanecek | 20-24 | WSH/N.J | 163 | 9138.53 | 6141.39 | 93.28 | 93.41 | -0.13 | -7.73 |
| David Rittich | 19-24 | CGY/TOR NSH/WPG L.A |
129 | 7066.86 | 4978.97 | 93.38 | 93.51 | -0.13 | -6.24 |
| Daniil Tarasov (G) | 21-24 | CBJ | 45 | 2425.45 | 2004.72 | 93.19 | 93.34 | -0.14 | -2.86 |
| Scott Wedgewood | 20-24 | N.J/ARI DAL |
106 | 5908.67 | 4333.55 | 93.25 | 93.41 | -0.16 | -6.94 |
| Marc-Andre Fleury | 19-24 | VGK/CHI MIN |
227 | 13198.52 | 8963.23 | 93.26 | 93.43 | -0.17 | -15.11 |
| John Gibson | 19-24 | ANA | 241 | 13808.21 | 11018.69 | 92.87 | 93.05 | -0.18 | -19.51 |
| Karel Vejmelka | 21-24 | ARI | 140 | 7754.19 | 6351.36 | 92.8 | 93.02 | -0.22 | -13.8 |
| Mackenzie Blackwood | 19-24 | N.J/S.J | 173 | 9736.37 | 7363.9 | 93.02 | 93.24 | -0.22 | -16.22 |
| Calvin Petersen | 19-24 | L.A/PHI | 95 | 5490.11 | 3868.24 | 92.9 | 93.21 | -0.31 | -11.83 |
| Philipp Grubauer | 19-24 | COL/SEA | 206 | 11597.2 | 7603.5 | 93.08 | 93.39 | -0.31 | -23.55 |
| Kevin Lankinen | 20-24 | CHI/NSH | 112 | 6250.99 | 4515.9 | 92.96 | 93.3 | -0.34 | -15.39 |
| Spencer Knight | 20-23 | FLA | 57 | 3115.55 | 2081.34 | 92.8 | 93.17 | -0.37 | -7.69 |
| Elvis Merzlikins | 19-24 | CBJ | 190 | 10450.94 | 8062.03 | 93.08 | 93.47 | -0.39 | -31.05 |
| Joonas Korpisalo | 19-24 | CBJ/L.A OTT |
186 | 10254.23 | 7421.84 | 92.69 | 93.21 | -0.52 | -38.75 |
| Cayden Primeau | 19-24 | MTL | 44 | 2303.63 | 1808.85 | 92.53 | 93.06 | -0.53 | -9.54 |
| Martin Jones | 19-24 | S.J/PHI SEA/TOR |
180 | 10020.53 | 7040.28 | 92.61 | 93.16 | -0.55 | -38.58 |
| Spencer Martin | 21-24 | VAN/CAR CBJ |
54 | 3060.75 | 2250.55 | 92.11 | 92.71 | -0.6 | -13.59 |
| Aaron Dell | 19-23 | S.J/N.J BUF |
56 | 2918.06 | 2164.3 | 92.64 | 93.24 | -0.6 | -13.06 |
| Jack Campbell | 19-24 | L.A/TOR EDM |
138 | 7939.94 | 5237.14 | 92.88 | 93.48 | -0.6 | -31.55 |
| Matt Murray | 19-23 | PIT/OTT TOR |
111 | 6296.19 | 4330.95 | 92.66 | 93.27 | -0.62 | -26.71 |
| Kaapo Kahkonen | 19-24 | MIN/S.J N.J |
139 | 7686.08 | 5964.91 | 92.82 | 93.47 | -0.66 | -39.08 |
| Nico Daws | 21-24 | N.J | 46 | 2415.58 | 1734.21 | 92.71 | 93.38 | -0.67 | -11.63 |
| Alex Stalock | 19-23 | MIN/S.J CHI |
66 | 3698.8 | 2652.24 | 93.26 | 94.03 | -0.77 | -20.37 |
| Dan Vladar | 20-24 | BOS/CGY | 75 | 4155.64 | 2827.01 | 92.54 | 93.4 | -0.86 | -24.37 |
| Michael Hutchinson | 19-24 | COL/TOR CBJ/DET |
43 | 2160.79 | 1652.83 | 92.21 | 93.12 | -0.9 | -14.93 |
| Malcolm Subban | 19-24 | CHI/VGK BUF/CBJ |
42 | 2286 | 1619.15 | 92.13 | 93.07 | -0.94 | -15.17 |
| Arvid Soderblom | 21-24 | CHI | 50 | 2735.38 | 2186.98 | 91.83 | 92.78 | -0.95 | -20.84 |
| Jonas Johansson | 19-24 | BUF/COL FLA/T.B |
61 | 3250.51 | 2210.56 | 91.78 | 93.19 | -1.41 | -31.25 |
Martin Jones teaches the same lesson of small samples of games, just in a very different way. And it also raises the question: did the Leafs get lucky or was his prior team so bad no one could look good there?
Jonas Johansson, the bottom left dot on the chart up above, the far left bar on the other one, is the lesson that disproves this "goalies are voodoo" nonsense that says just play anyone. No, don't. You can actually make the distinction between a warm body who should never get in a game and a player who is at least NHL-level. You just struggle to make more granular sorts or to know exactly what the results will be season over season.


Comment Navigation & Markdown
Navigation
cc to focus on comments section
c next comment
x previous comment
z next unread comment
Inline Styles
Bold: **Text**
Italics: *Text*
Both: ***Text***
Strikethrough: ~~Text~~
Code: `Text` used as sarcasm font at PPP
Spoiler: !!Text!!