

Random is a dirty word to a lot of people. If you say "hockey is very random", they will swear they heard you say there are no reasons for anything that happens in the game, chance rules and skill doesn't matter. Everything is a coinflip.
Of course skill does matter. Skills of all sorts drive every part of a team's success, but the power of elite skill or even just very good skill shares time and space with random events in every moment of play. Random events may have causes, but they are caused by things beyond the player's control. And people are generally not very good at seeing what is random and what is created.
Everything we think we see is created by our brains as an abstraction of the reality we're observing. The missing bits are filled in by millions of simulations, er no that's the deserve to win thingy. It's filled in by some squishy brain stuff. It's an abstraction of the reality we can't ever directly experience. It's such a good abstraction that it serves our needs in almost everything we do and is reality to us.
We learn about the world as we grow up, concepts like up and down don't need much explanation and we rarely need to take into account that they are relative to the sphere we live on that's hurtling through space, spinning all the while. Up is a good enough abstraction of farther from the centre for most purposes.
As we learn about new aspects of the world, we add some more abstractions to our toolkit. One of the abstractions we all all walk around with is is what we think randomness looks like. As soon as you learn about coins and head and tails and the 50/50 rule for flipping the coin, you make an abstraction of what that looks like. A lot of people will "see" that process as a couple of heads, three tails, some heads, a few tails. Not regular, but no big streaks of either result.
The images below are two similar plots of dots. One is from a simulation of a theory about how glow worms spread themselves out on the ceiling of a cave in New Zealand – a non-random process created by intentional actions. And the other is just burped out by a random number generator in JavaScript. Can you tell which is which?
↔If you've ever been asked a trick question, or if you've taken a class that covered this, you likely know that the very comfortable, evenly spaced set of dots on the right is from a pattern and the one on the left full of clumps and holes is the truly random scatter.
They're made with live JavaScript, so if you reload the page, you'll see updated versions. The pattern set is nudged off a regular grid by some gentle randomness to make it uneven enough to fool you.
That was easy. Too easy. Because when you're watching a hockey game, a lot is going on. It's not two-dimensional, it's chaos. So I found a better example and adapted it to my own ends.
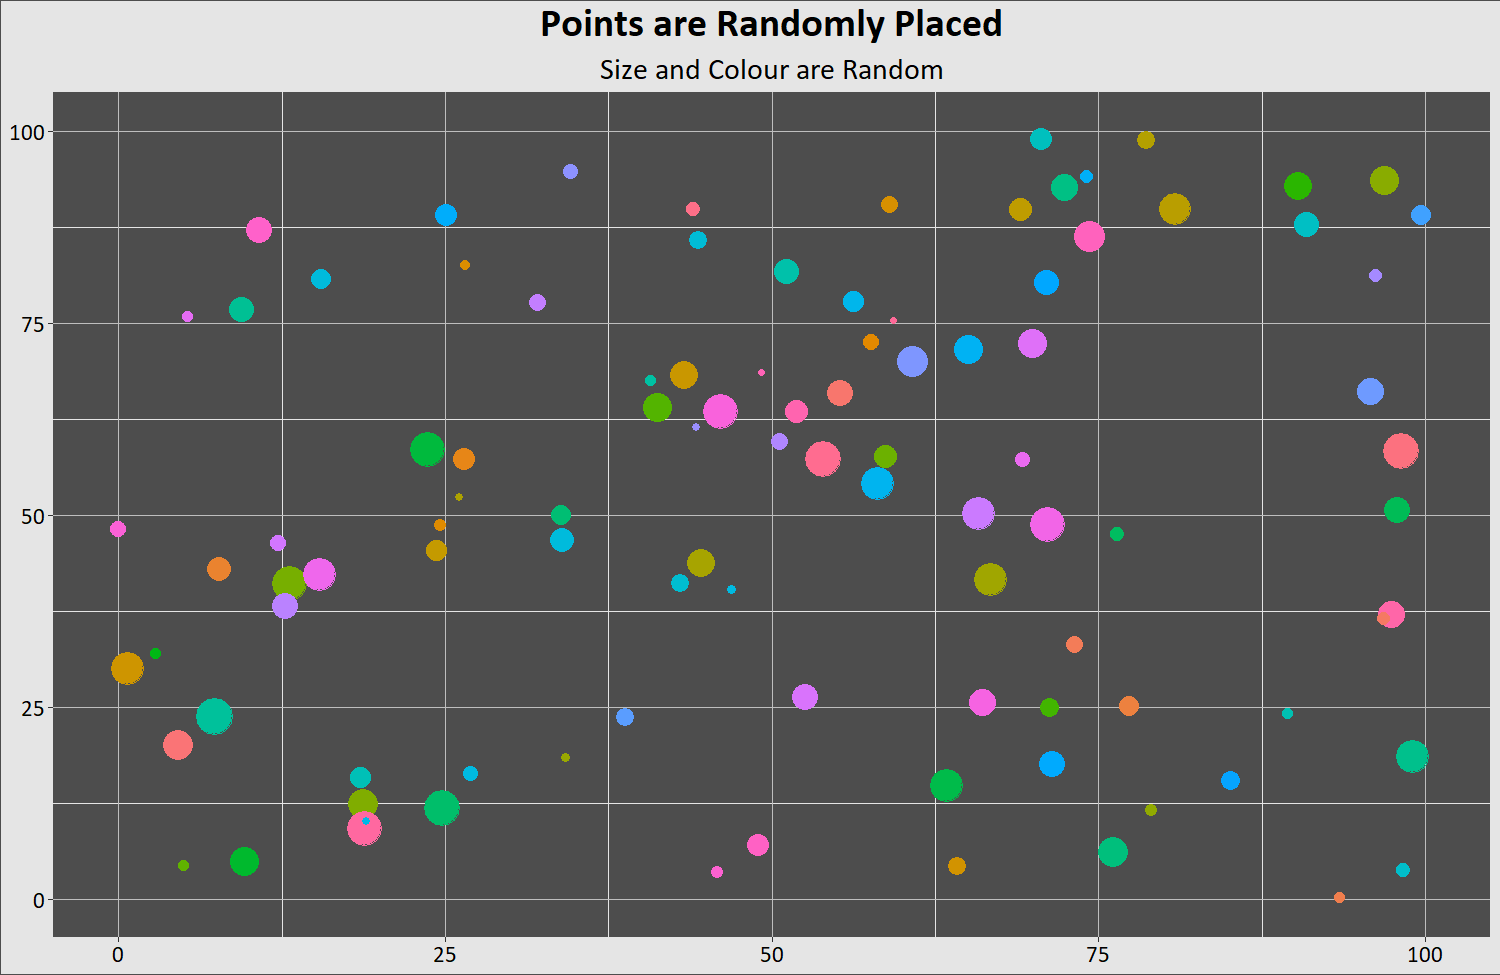
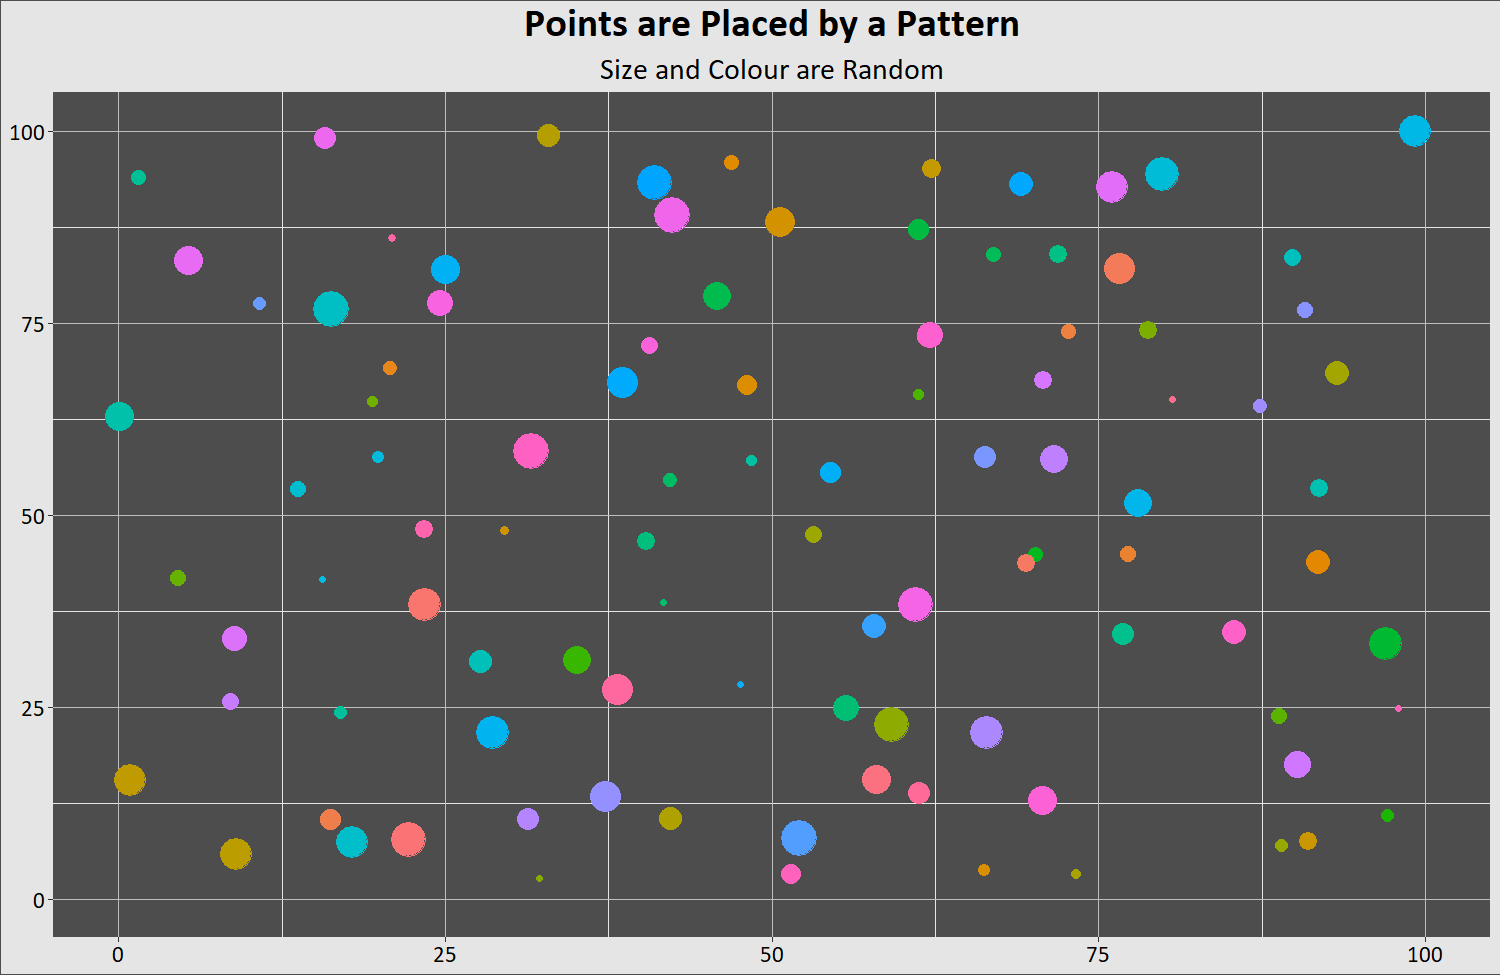
The pattern is nudged a little harder by some random jittering, and the colours and sizes are here to simulate a little what it's like watching a game where all kinds of measurable things happen, sometimes at once.
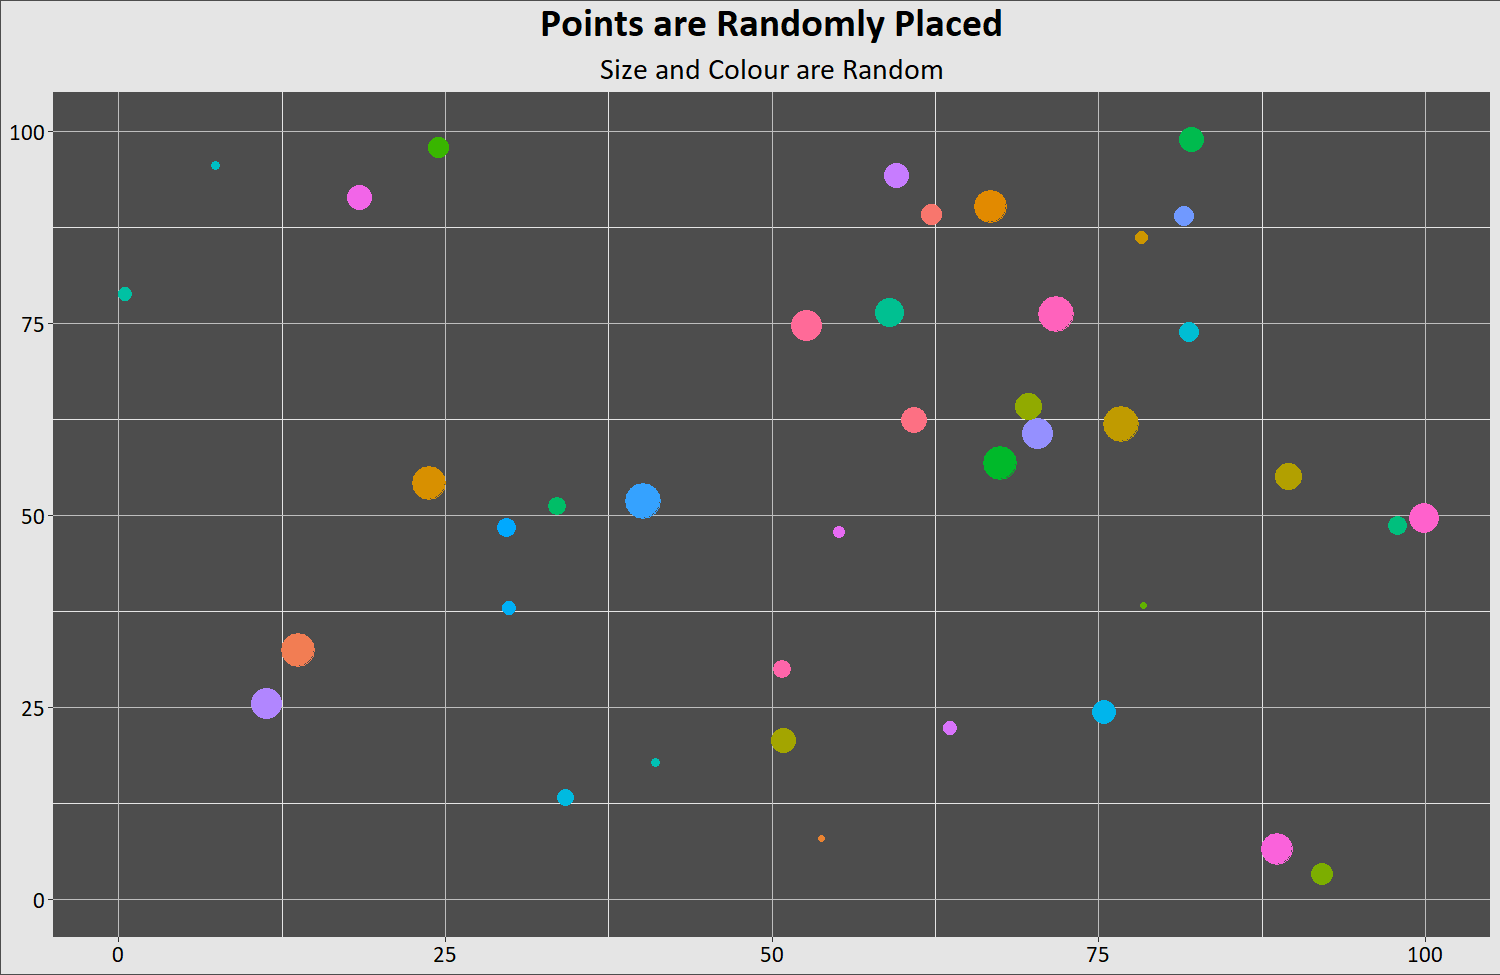
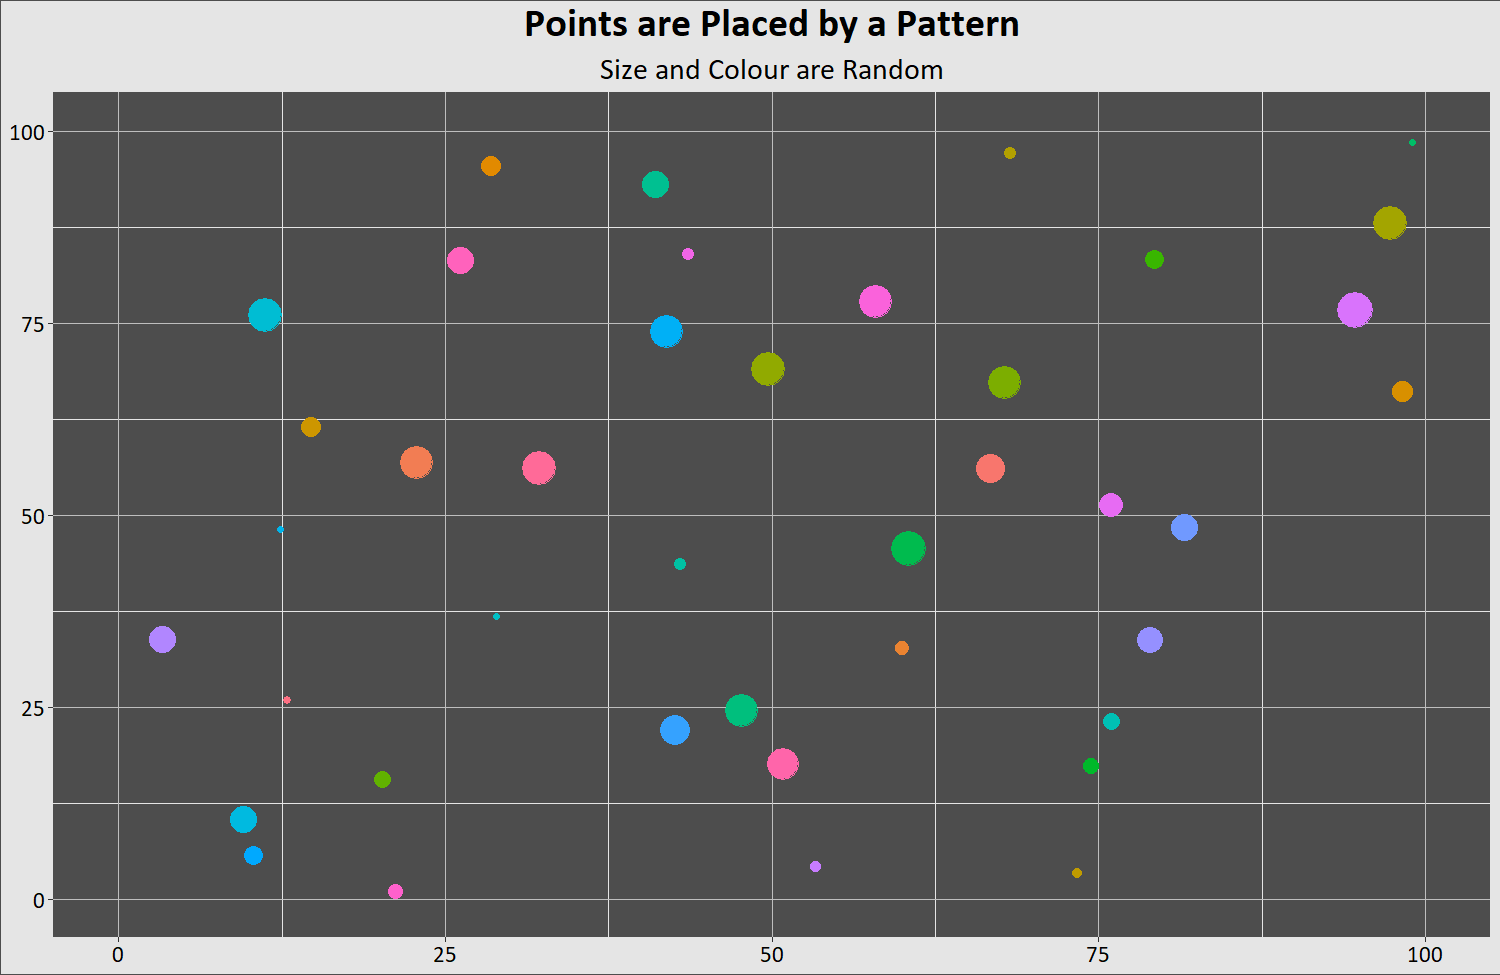
40 points in each
With fewer events it's harder to tell which is which, but the random scatter nearly always has much bigger holes and more obvious clumps.
Okay, now that you've seen what randomness looks like, and what a pattern looks like, you're ready to look at the thing that makes hockey random. Goals. There aren't very many goals in a hockey game compared to other team sports, so one extra or one less can be the game. Random forces exert power in hockey much more powerfully than the gentle random breeze that shifts the patterned points in the examples above.
If you ask your favourite search engine if goals in the NHL are a Poisson process or distribution you'll find a lot of university and other projects proving that this is true, and a few that argue it nearly is, but not quite. That's an esoteric argument that isn't going to help any of us today. Nearly is good enough. A Poisson distribution means that events happen randomly at their inherent rate over a given period of time.
We know where goals come from. They come from shots. And we know where the rate of scoring comes from, it's from the number of and quality of those shots processed by the skill of the shooter and the goalie and influenced by a host of other players on the ice. Number and quality of shots is what Expected Goals (xG) is. A player's own xG is denoted as ixG and it's calculated on their own unblocked shots. The biggest component of xG is volume of shots. The other factors just weight that number and add more accuracy.
Once a player has enough games played, the skill of the goalies he's faced tends towards average and drops out of the picture. ixG on its own predicts future goals scored better than anything else. How many games is enough? This old Hockey Graphs post has some data on how much ixG data you need. Spoiler: it's not one game. And try to remember predictions aren't prophesies. Today is not about foretelling the future, though, it's about understanding the past.
Back to Poisson. Players' scoring rates over a whole season change from year-to-year as it fluctuates around what will become an individual's career average. Big fluctuations are possible, some few players are very consistent at how much they score each year. But that is where consistency stops. Poisson is a random process. So let's see some goal scoring.
Note: the following charts show goals by season with all breaks in games-played removed. Time lost to Christmas, the ASG, injuries, suspension, or anything else is removed. What's left is how many minutes of TOI elapsed for that player between games he scored in.
I started with a guy I consider a good secondary player, a middle-six player who gets around 14 minutes a game, and scores about 20 or so goals in a year. I don't want to tell you who he is because a lot of you don't like him, and I don't want that to influence how you see his career.
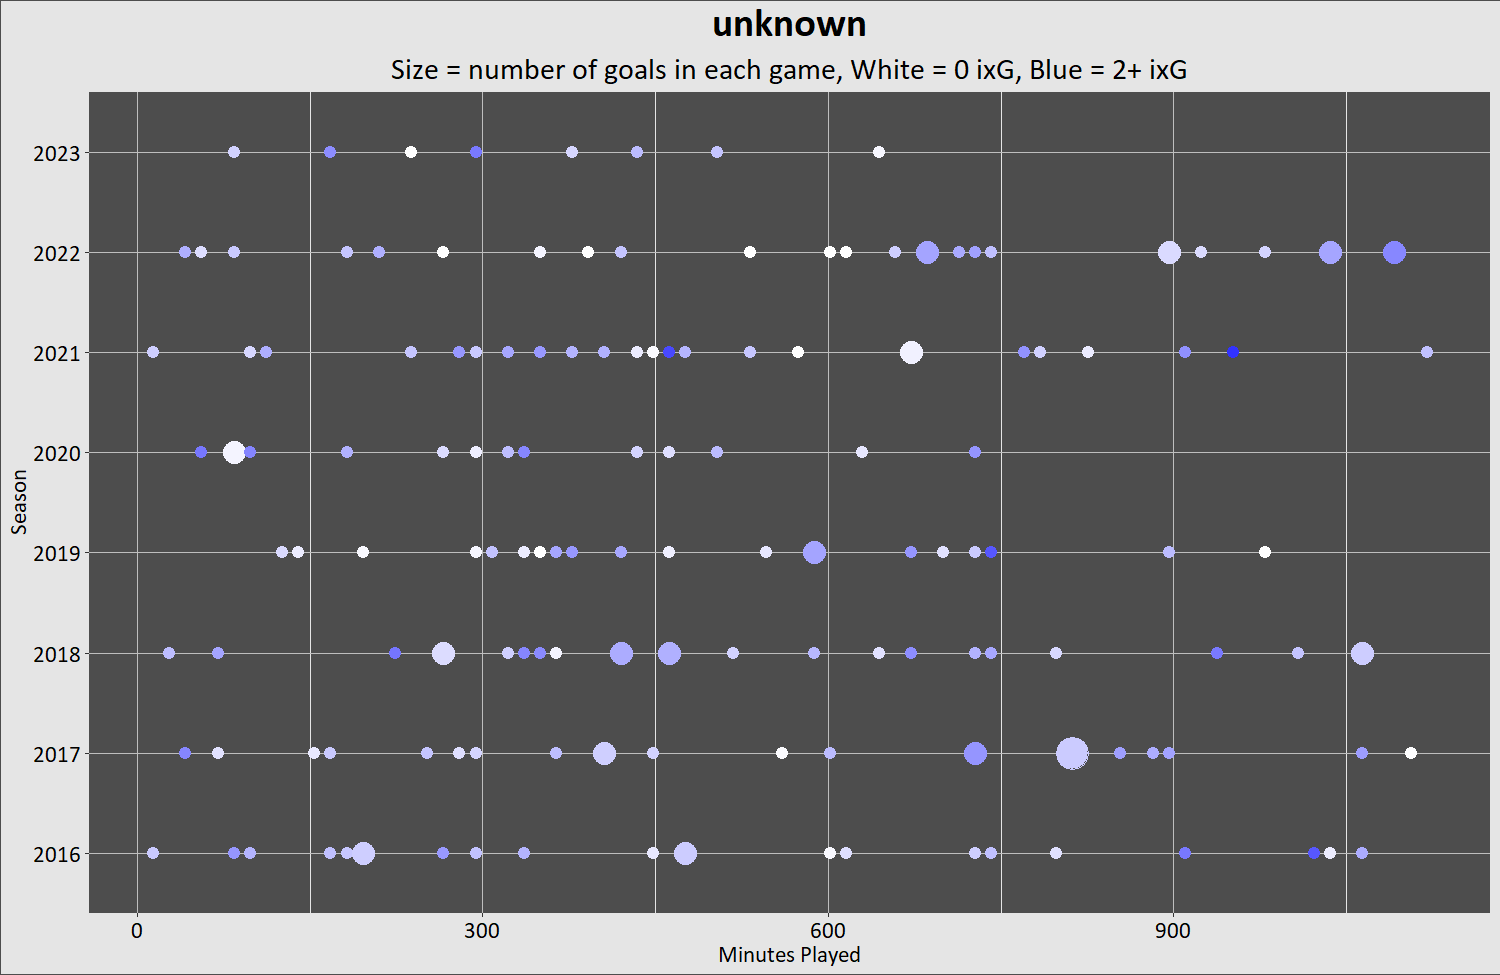
That looks random to me. This guy doesn't get a lot of multi-goal games, but he puts up numbers. He's not having a spectacular year this season, and he didn't in the pandemic year either. He's gone some long stretches without scoring, and he's had some streaks. Remember the breaks aren't games off, they are minutes played between goal-scoring games. It's pretty hard to see any correlation between his ixG and his goals, game-in and game-out. But he's got a good overall rate – around .80 to .85 most years.
Season denotes the first year, so 2020 is actually the year played entirely in 2021.
Okay, now for some people you like. Or at least have watched a lot.
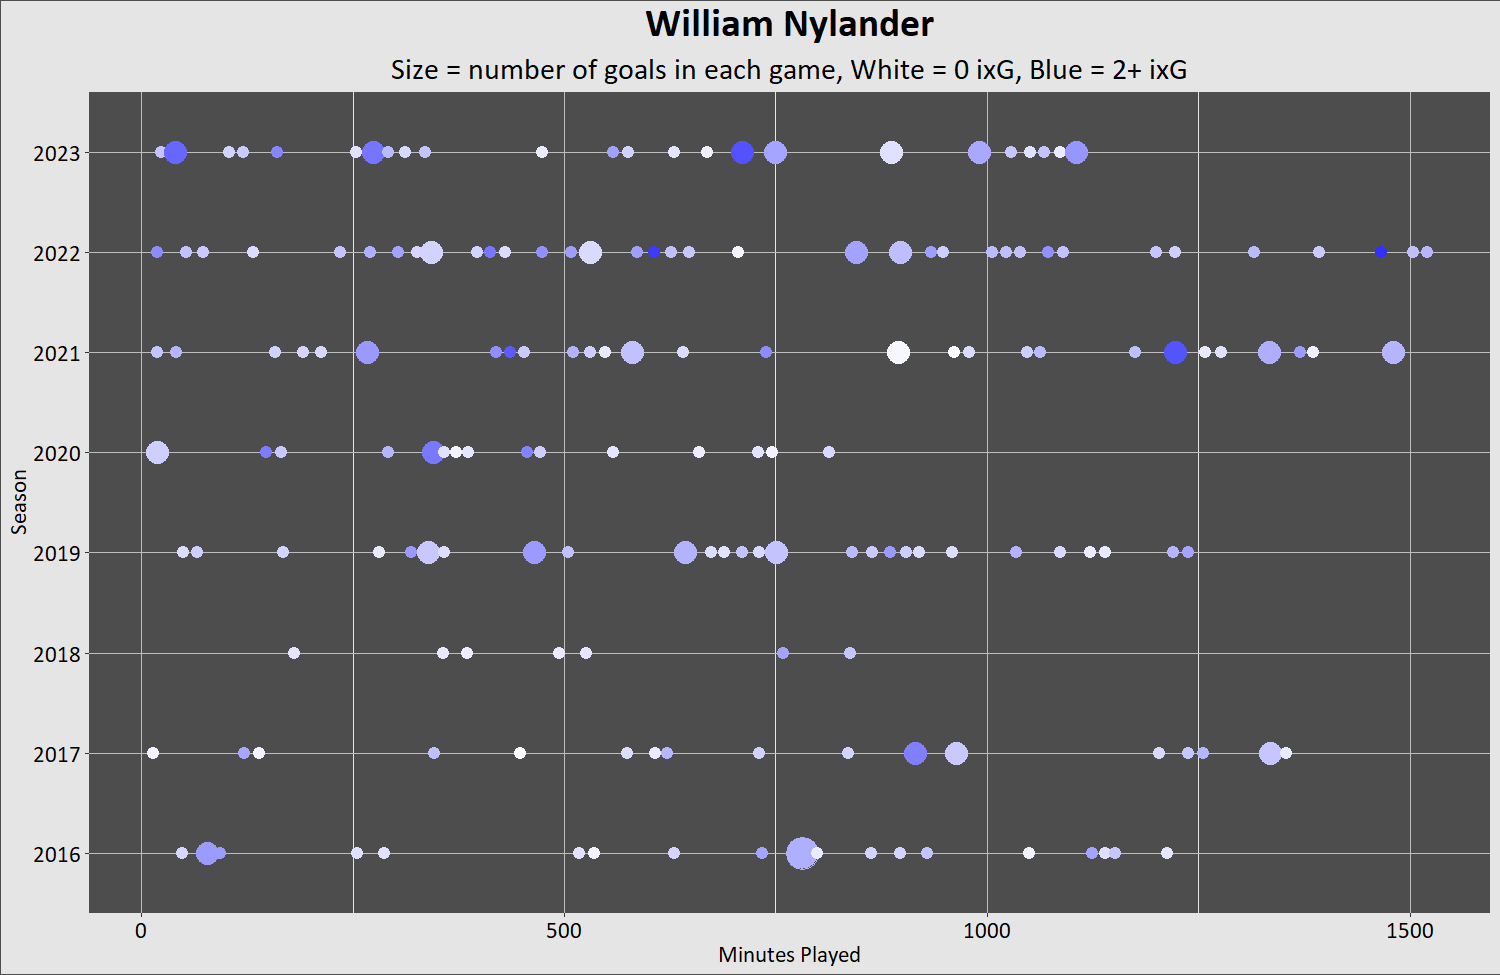
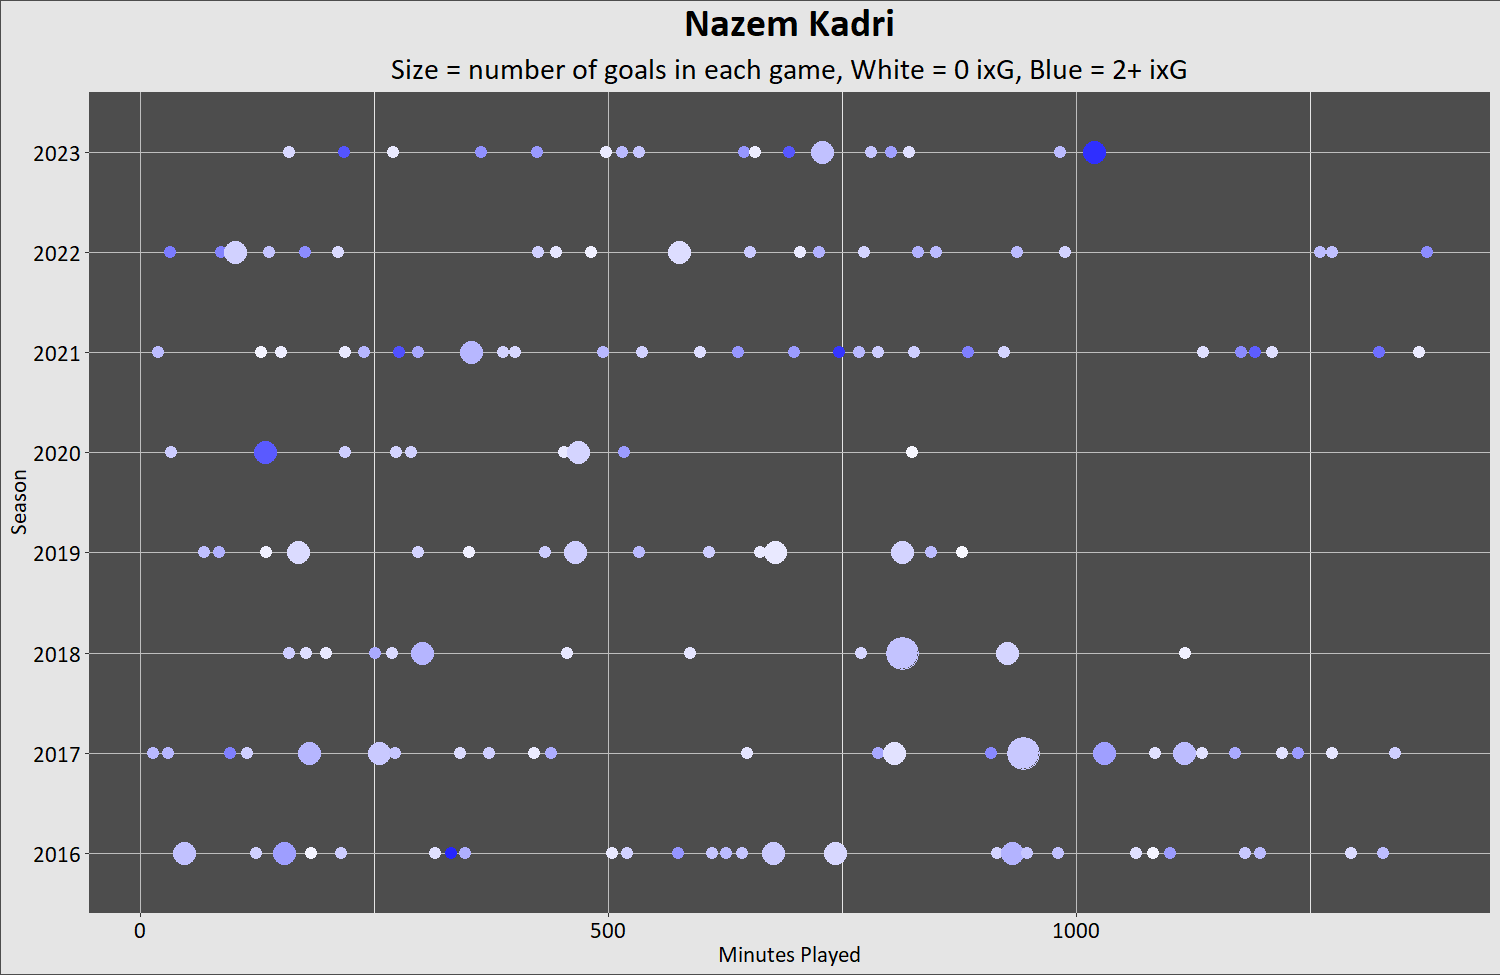
Big gaps, big clumps. No two seasons look the same, but you know it's him because of the dearth of hat tricks. And it's always the gaps where a story, an explanation is sought. But look at that run to end the 2019-2020 season. That's so regular! That's the weird bit. What on earth is the explanation? Had he hypnotized all the goalies?
Now the best goal scorer since 2016:
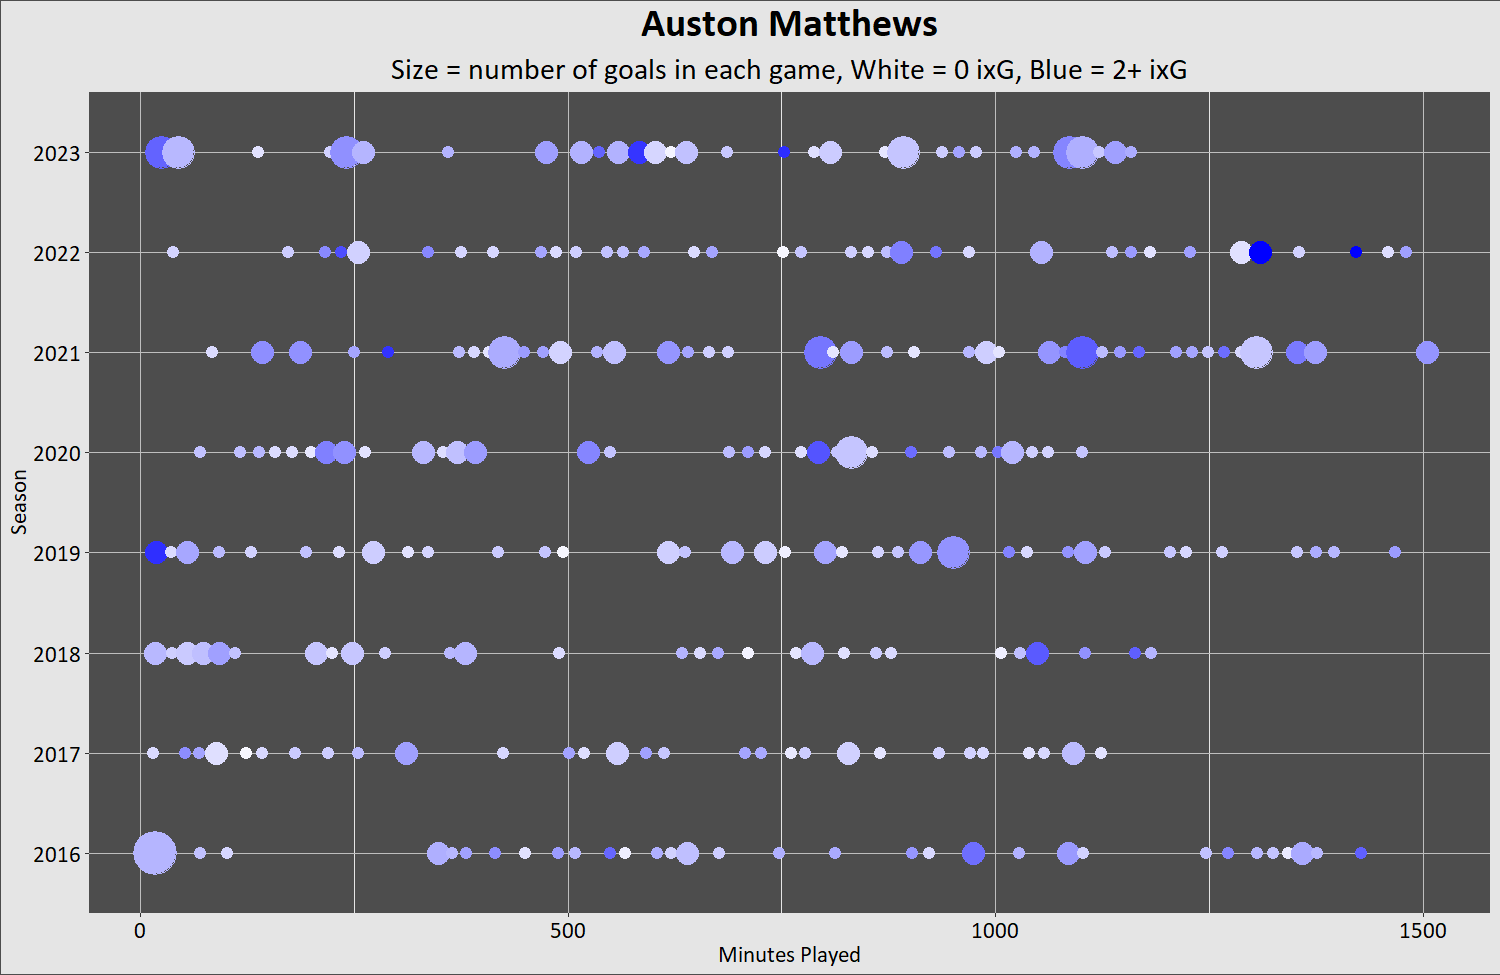
Clumps, empty spaces, lots of multi-goal games one year, none the other. There's a story you can devise for every break in the action. And there are identifiable things you can name in the set of random events outside the player's control. Everyone knows about Matthews' injury history. But don't fall into the "just one thing" explains it all trap. All the random events that make goal scoring show a Poisson distribution are still there.
The desire for an ordered, comfortable world is understandable. There's a lot of people who want the glow worm universe to deal out randomness from a deck of cards, one to each person. Fair. Even. And if it's not, someone in a black hat is to blame. But the best goal-scorer in the world produces goals in a random way.
By the way, Auston Matthews has the highest ixG of any player charted here at 2.4. There are very few fully blue dots over all the charts.
A secondary player looks like this:
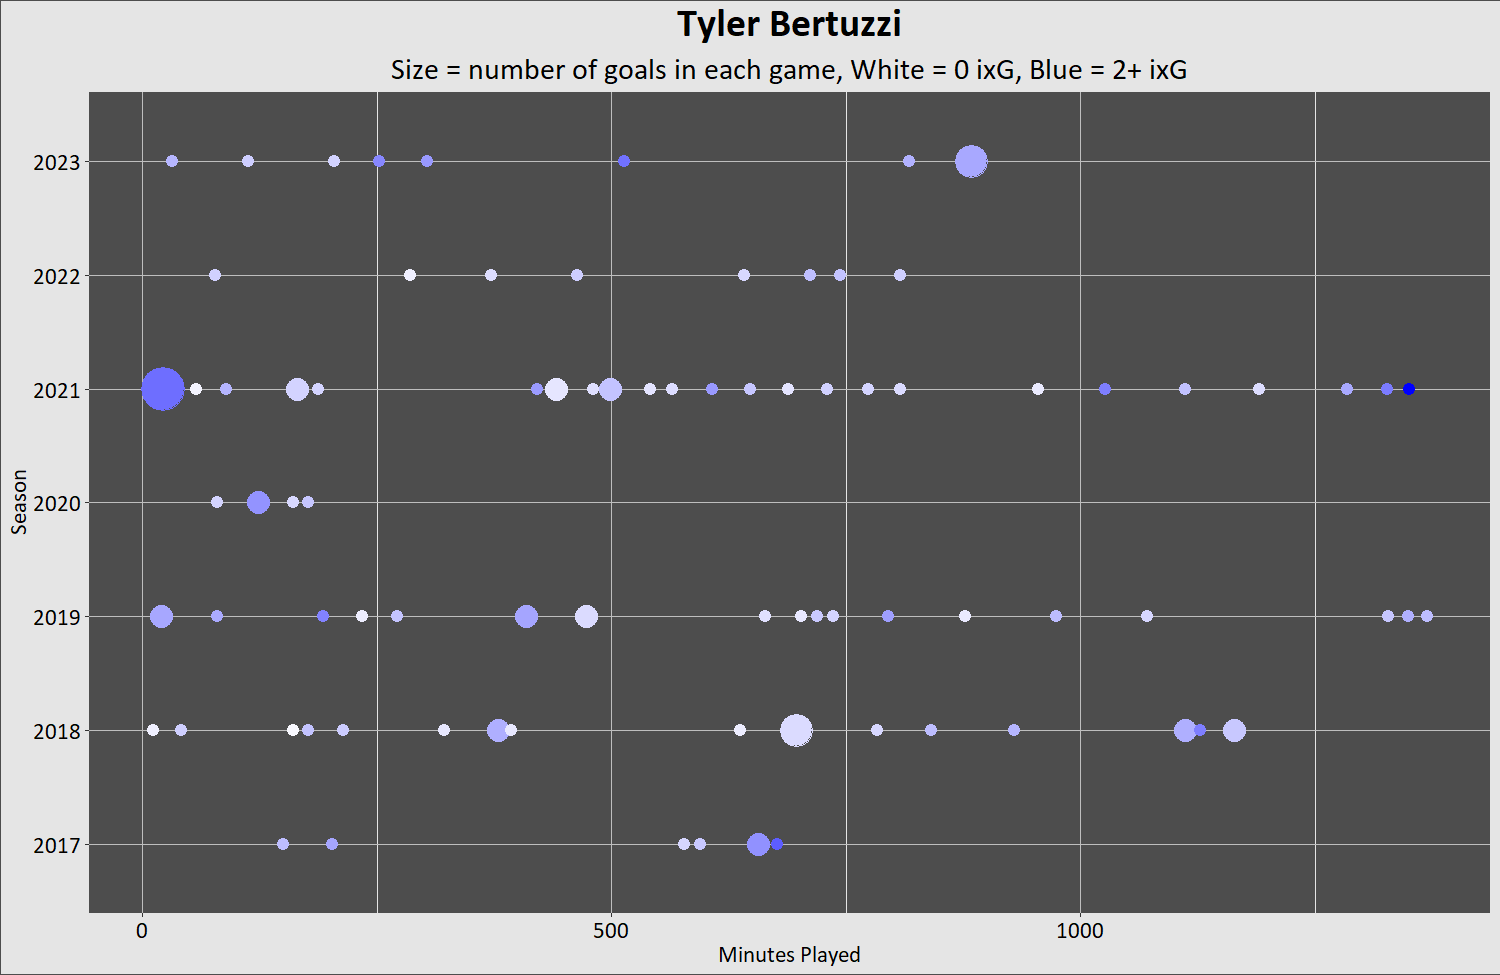
Why is he so bad and overpaid? Or why was he good and underpaid? Well, you see his goals are randomly distributed based on his inherent rate of... not very dramatic a tale is it? He's cursed or he's just old now, or it's a contract year. You see that story all the time, and people believe in it fully. It's easier if you just ignore the times that don't fit the pattern. Like now.
You can see growth in young players – you can see Bertuzzi getting better as he comes into his peak years. You can see players age if you pick the right seasons for that individual. But that's the rate. Skill resides in the rate. The placement is unpredictable. And while ixG predicts the future better than other things, I think we've seen enough to realize that single game ixG isn't going to tell you how many goals went in the net.
Remember the last time a guy on the Leafs seemed like he would never score?
Flash back to early 2018, and he's a bum who never scores. But just a few months earlier at the end of 2017-2018, he was a hero. Pick your endpoints, make a story.
Now we all know how randomness influences goal scoring. This post has definitely not been brought to you by a gambling company.
There are a million true stories about hockey. Just watch Auston Matthews for a game or two and you'll find a lot. Goal streaks and droughts, scoring "races" and Bobby McMann are fun things to talk about. But demanding a player "try hard" the puck in the net is a fable about work ethic, not how the game works. When you know where goals come from, and when they come, then you can start looking for the true stories in the game.
Oh, sorry, I forgot to tell you who the first guy is. He's fake. I generated a Poisson distribution using a 20-25 goal per 82 game season rate, and I gave him fake ixG based on Kadri's distribution, but randomly generated. I got lazy and gave him exactly 14 minutes in every game, and looked up Phil Kessel's games played to make him an iron man who plays every game. His goals would be even more classically random-looking with more realistically variable ice time. But he's a solid, consistent supplementary player who every Leafs fan would want to trade this season because he's not earning his $5 million cap hit.


Comment Navigation & Markdown
Navigation
cc to focus on comments section
c next comment
x previous comment
z next unread comment
Inline Styles
Bold: **Text**
Italics: *Text*
Both: ***Text***
Strikethrough: ~~Text~~
Code: `Text` used as sarcasm font at PPP
Spoiler: !!Text!!