

Per Darren Dreger: Three years at $7 million per year.
Sergei Bobrovsky would be considered a bit small if he'd been a draft prospect last week. He's 6'2" and listed at 183 lbs. Compare that to Anthony Stolarz who is 6'6" and listed at 247 lbs.
Bobrovsky might be still tending goal at a very high level at 37 because of those different numbers since goalies sometimes suffer more at higher weights. But who can ever tell anything about a goalie for sure?
In 2019, Dale Tallon, then GM of the Florida Panthers, signed Bobrovsky to a seven-year deal for $10 million. At the time, many people thought it was one of the most absurd contracts ever written, and Bobrovsky's play in the first few seasons behind a very bad team didn't help that image.
Tallon, who was back in charge of the team after an experimental period with a rookie GM with new ideas, took a big swing in landing the biggest free agent of 2019. Tallon left the team the next year for many reasons, but the high-risk move and lack of initial reward from Bobrovsky has to be part of it. No one predicted Bobrovsky would be lifting the Cup (twice) near the end of the term on the deal.
The lesson we'll want to focus on here is that you can't judge a risky move too soon. Trust me, we'll really want to keep that in mind this season.
With Bobrovsky a UFA, the question was immediate about where he would go next. There are reports that he asked for a lot of term to remain in Florida – and his reasons could be many – that he wanted to leave but have it look like the team's choice, or that he knew they didn't want him and didn't want that public, or he thinks he should get a six year deal in a just universe. You have to have enormous self-belief to be a goalie.
The rest of us, on the other hand, will struggle to get on board. I don't believe we have any way out here in the public of predicting future goalie performance with any sort of accuracy. I would rather guess at the points a defensive defenceman will get than predict a goalie's next season.
I'm not going to dig deep into any numbers, instead I'm showing you this:
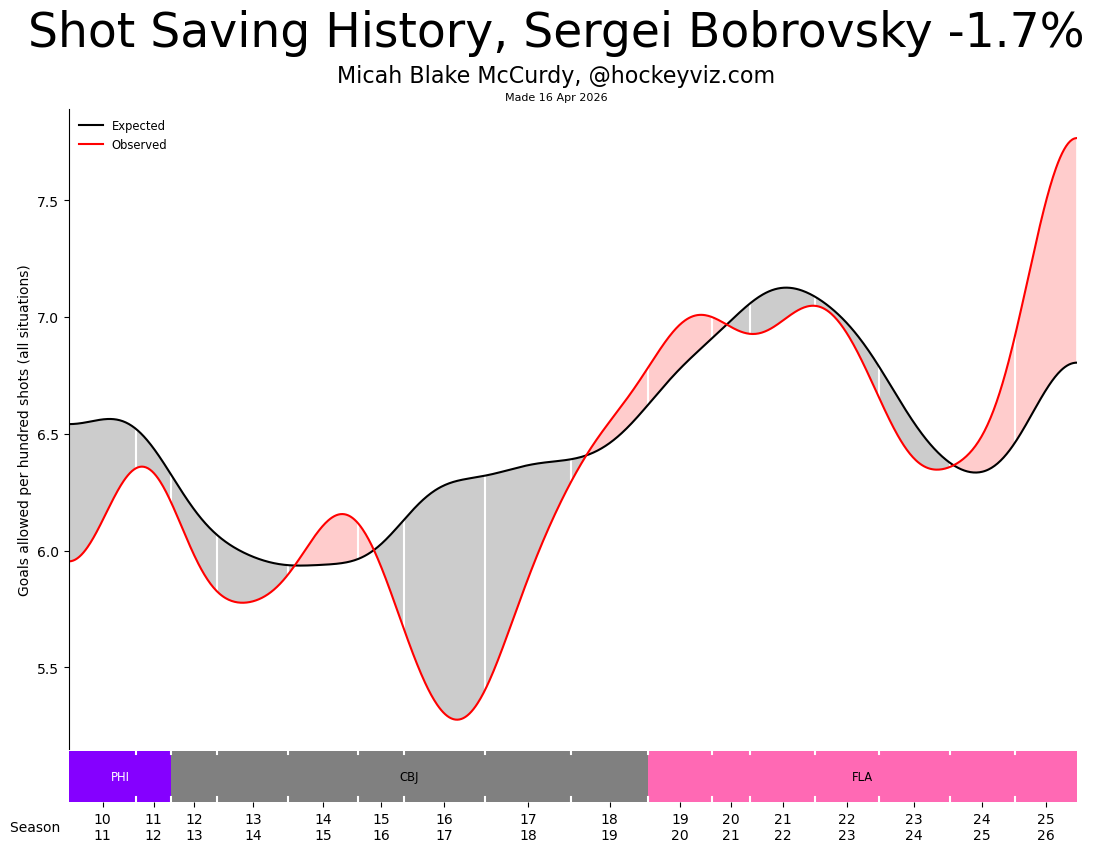
The black line is Expected Goals Allowed per hundred shots in all-situations. In other words this is the rate not the amount, so if the black line goes up you are not seeing the team allowing more shots, you are seeing the team allowing harder shots to save in the aggregate. Clearly Florida was different to Columbus with the exception being those two golden years of cup wins.
The red line is goals actually allowed. And yes, if you make the classic mistake of applying action verbs to a line graph, you might think it is "going up". Line graphs aren't objects in space with inertia and momentum. The laws of physics that we humans are used to thinking with – all unknowingly – don't apply.
Yes, I'm talking about the theory of measuring a goalie and how we misread charts because I don't have one single clue where those lines will go.
This is big risk. Risks don't pay off right away sometimes, just ask Dale. And goalies are still deeply mysterious. This doesn't mean they can't be understood, just that we don't have the information to form good opinions. Which is perfect! No need to work at it, just come up with a slogan and repeat it every loudly!
Sergei Bobrovsky, welcome to Toronto, you are now the living, breathing Rorschach test of a giant fandom prone to negativity. What could possibly go wrong?
Some numerical data from Evolving Hockey if you like numbers more than pictures:
| Season | Team | GP | TOI | FA | xGA | GA | GSAx | xFSv% | FSv% | dFSv% |
|---|---|---|---|---|---|---|---|---|---|---|
| 10-11 | PHI | 54 | 3017.37 | 2089.28 | 141.91 | 130.03 | 11.88 | 93.21 | 93.78 | 0.57 |
| 11-12 | PHI | 29 | 1550.03 | 1092.25 | 77.39 | 78.87 | -1.48 | 92.91 | 92.78 | -0.14 |
| 12-13 | CBJ | 38 | 2218.95 | 1462.39 | 83.95 | 73.33 | 10.62 | 94.26 | 94.99 | 0.73 |
| 13-14 | CBJ | 58 | 3299.43 | 2208.8 | 128.39 | 130.76 | -2.37 | 94.19 | 94.08 | -0.11 |
| 14-15 | CBJ | 51 | 2994.2 | 2207.32 | 128.91 | 135.04 | -6.13 | 94.16 | 93.88 | -0.28 |
| 15-16 | CBJ | 37 | 2116.35 | 1444.14 | 90.8 | 99.16 | -8.36 | 93.71 | 93.13 | -0.58 |
| 16-17 | CBJ | 63 | 3707.07 | 2536.4 | 171.53 | 126.43 | 45.1 | 93.24 | 95.02 | 1.78 |
| 17-18 | CBJ | 65 | 3911.47 | 2708.7 | 179.41 | 157.1 | 22.31 | 93.38 | 94.2 | 0.82 |
| 18-19 | CBJ | 62 | 3556.23 | 2390.76 | 151.02 | 153.86 | -2.84 | 93.68 | 93.56 | -0.12 |
| 19-20 | FLA | 50 | 2805.78 | 2019.25 | 137.54 | 151 | -13.46 | 93.19 | 92.52 | -0.67 |
| 20-21 | FLA | 31 | 1814.87 | 1182.28 | 77.22 | 87.19 | -9.97 | 93.47 | 92.63 | -0.84 |
| 21-22 | FLA | 54 | 3082.03 | 2023.85 | 149.78 | 137.64 | 12.14 | 92.6 | 93.2 | 0.6 |
| 22-23 | FLA | 50 | 2833.65 | 2029.3 | 148.77 | 145.85 | 2.92 | 92.67 | 92.81 | 0.14 |
| 23-24 | FLA | 58 | 3414.23 | 2208.91 | 151.62 | 135.86 | 15.76 | 93.14 | 93.85 | 0.71 |
| 24-25 | FLA | 54 | 3199.97 | 2042.05 | 139.45 | 130.49 | 8.96 | 93.17 | 93.61 | 0.44 |
| 25-26 | FLA | 52 | 3009.65 | 1953.58 | 152.73 | 154.48 | -1.75 | 92.18 | 92.09 | -0.09 |
That AAV though.


Comment Navigation & Markdown
Navigation
cc to focus on comments section
c next comment
x previous comment
z next unread comment
Inline Styles
Bold: **Text**
Italics: *Text*
Both: ***Text***
Strikethrough: ~~Text~~
Code: `Text` used as sarcasm font at PPP
Spoiler: !!Text!!