
So I think I'm getting somewhere with this SDI thing. I've been refining it repeatedly, regularly and iteratively since I first came up with the idea of comparing D men's statistical outcomes defensively using shot based metrics. This is my 5th posting on the topic, and the first part of the final update for the 2012-13 NHL regular season.
I've taken ideas here and there from others based on suggestions and observations. Some changes and brain-waves were all my own (sometimes to my detriment). Generally speaking though, I think the outcome is getting more and more in line with a logical outcome that passes the smell test. All of that being said, I do very much welcome questions, comments and ideas from anyone reading this. I want this to get better, and I'm happy to discuss pluses and minuses of various approaches along the way.
What does this all mean? It means I think I'm getting closer to a means to assess whether a "shut down" defender is actually good at his job or if he just happens to be on the ice in his own end a lot to the detriment of his team. Some defensive D men are actually solid defensively. Some are just guys that suck the life out of their teams offensively and don't actually do much to help your team stop the opposition (Yes I mean YOU Ryan O'Byrne).
I think a lot of this work is getting at a means of assessing players being used in the appropriate role defensively - which is frankly not something I think NHL teams (or their fans) excel at. I'm trying to help people wade through some of what we are currently using multiple stats to assess. By working through some of the context issues, we can identify who is and who isn't playing effectively.
This first posting will explore the logic behind, and usefulness of, the SDI statistic in it's current iteration. So here is some of the logic behind the changes that have been made.
Changes
I've made some tinkering to the input and refined some of the process to clarify a few things. It was pointed out to me that using Corsi REL QoT is relatively flawed because Behind The Net includes ice time where the player in question is on the ice in the calculation. This led to some further analysis that I undertook comparing the impacts of Team CA20, Team CF20, and Opp CF20 and Opp CA20 on a player's offensive and defensive results - this was fleshed out in detail by Pierce Cuneen at Broad Street Hockey here - I strongly suggest you read that posting as the information contained in it is highly relevant to the rest of this discussion.
For this reason I have switched to making use of the Team CA20 from stats.hockeyanalysis.com because it is based on all of the ice time a player's line mates have WITHOUT them on the ice. This mitigates against some of the multi-collinearity and team effect issues, but introduces sample size problems in a different sense. For similar reasons, I decided to include Opp CF20 from stats.hockeyanalysis.com rather than using Corsi REL QoC. Again - the goal was to assess competition without impacts that include the player being analysed.
Justification of Focus
Some have been of the opinion that assessing Corsi Against is sort of useless because I could be capturing "offensive" play by D men who are solid puck carriers and really I should JUST be exploring Corsi as a whole - not splitting Corsi Against and Corsi For.
@RangerSmurf @SteveBurtch I'm mocking Burtch here for, as I put it in my blog post, the fact that he's capturing O here.
— garik16 (@garik16) July 26, 2013
Unfortunately - having checked to see if this is plausible - there is virtually no correlation between Corsi For and Corsi Against (R^2 of 1.1%). In other words, defensive Corsi and offensive Corsi events are NOT linked as closely as some people seem to think.
Here is a graph displaying the correlation between the Expected Corsi Against (Based upon the input values of TeamCA20, OppCF20, and DZFO%) versus the output of a player's actual Corsi Against for all NHL defenders to play 200+ minutes of 5v5 TOI over the past 6 years. (*all statistics are courtesy stats.hockeyanalysis.com*)
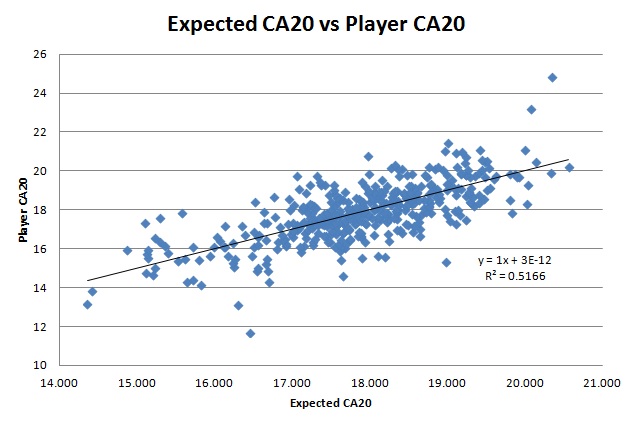
As you can see, those 3 input values account for 51.66% of what we observe for a given defender in terms of Corsi Against. His usage, team-mates, and opposition all carry weight in his defensive outcomes - though the single most important factor would be the Corsi Against results of his team-mates (as shown in Pierce's posting).
SDI - or Shut Down Index (although to be clear this is no longer an index value) is just the residual score from this correlation. In other words, the difference between a player's Expected and Actual Corsi Against performance. Players who have a lower than expected Corsi Against will have a positive SDI score, players with a higher than expected Corsi Against will have a negative SDI score.
The distribution of results for 6 year SDI scores amongst the 421 defenders to play 200+ minutes of 5v5 TOI over the last 6 seasons of NHL hockey is actually surprisingly (or unsurprisingly depending on your outlook) normal, as indicated below. The Kurtosis of the data is +1.89, and the Skewness is +0.088, which is to say the peak of the curve is higher than a perfectly normal distribution (Kurtosis = 0.0) and it is skewed slightly towards the right (very slightly positive). This implies the distribution at the upper end of the range is more spread out. One way we might interpret this is that NHL defenders are largely the victims of randomness and to an extent there is little in the way individual control possible in these results. A normal distribution implies that we should expect the vast majority of defenders to be "average" in this aspect, and we can largely assume variance in their results are due to randomness beyond their control.
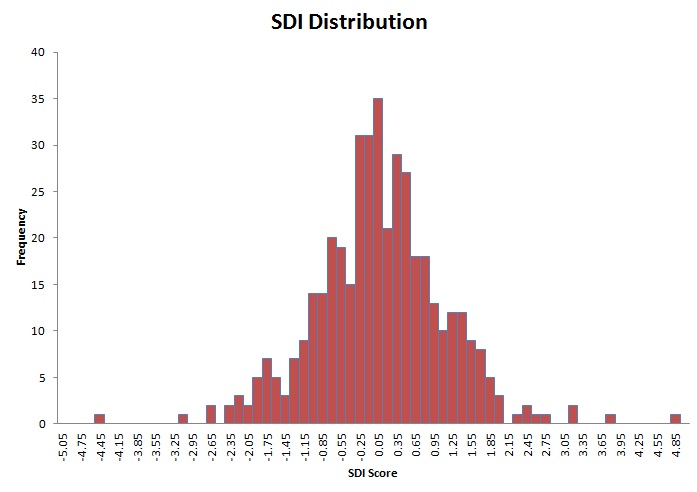
The flip side of this understanding though, is the corollary statement that players who exhibit extreme results in either the positive or negative case, over an extended period of time, are likely the most significant contributors to their results. In other words, once a player's results consistently end up outside expected limits consistently, we know they're either extremely good defensively, or extremely bad. They're consistently trumping the effects of randomness.
The mean value for the 6 year sample of SDI is essentially 0.000, and the standard deviation is 1.047, which means 95% of the results fall within a range from -2.093 and +2.093. No currently active NHL player with over 2000 minutes of 5v5 TOI in the past 6 seasons lies outside this range on the positive side, and only two players lie outside of it on the negative side. They are excessively bad from a Corsi Against Perspective... to the point that one should question why they remain active in the NHL as defenders.
Repeatability and Reliability
In an effort to assess the reliability and repeatability of the statistic I decided to compare three year scores for individual defenders, by dividing the 6 year set into two 3 year sets (2007-10 and 2010-13) and comparing the players who played over 1000 minutes of 5v5 TOI in both sets. The results are actually quite promising. I've broken the group down further into 3 sub groups for analysis below.
| R / R^2 | 2010-13 TOI | ||
|---|---|---|---|
| 2007-10 TOI | 1000+ | 2000+ | 3000+ |
| 1000+ | 0.459 / 0.211 | 0.544 / 0.296 | 0.554 / 0.307 |
| 2000+ | 0.483 / 0.233 | 0.564 / 0.318 | 0.587 / 0.344 |
| 3000+ | 0.580 / 0.336 | 0.611 / 0.373 | 0.632 / 0.399 |
The implication above is that to a fairly large extent, SDI is a repeatable skill. Particularly once we have 3000+ minutes of 5v5 TOI to look at. 1000 minutes of 5v5 TOI is a decent approximation for one season of data for a top 4 D man in the NHL (121 Defenders played 1000 or more minutes of 5v5 TOI in the 2011-12 season). For a top 4 D man with 3000+ minutes of TOI, we should regress his SDI score about 42% towards the league average of 0 from his existing score in order to assess his expected results for the following season.
While that may seem like a large proportion, consider that this means if a player's current SDI score after 3261:14 in 5v5 TOI is +1.582, a regression of 42% towards the NHL average of 0.000 would still mean we should expect his future SDI score to end up around 0.918, which corresponds to the 81st percentile for all NHL D-men in the 6 year sample. The player with that score is P.K. Subban of the Montreal Canadiens. Obviously Subban's performance to date is exemplary in a defensive regard, and it is extremely unlikely that he will slide down to become average or below average in the near term.
As a contrast, consider the case of Jack Johnson now with Columbus and formerly with Los Angeles. According to 6 years worth of data Johnson has played 6796:16 of 5v5 TOI. His SDI score over that time frame is an abysmal -2.680. Over the first 3 seasons from 2007-10 he produced an SDI score of -3.293, and in the 3 years since, from 2010-13, his SDI score is a still alarmingly bad -2.255. His SDI score regressed 31.5% over the second time period back up towards the NHL average of 0.000, but he's still atrocious defensively no matter how you slice it.
While there IS quite a bit of variation seasonally, likely due to things like changes in D partners, teams, aging, maturity, etc. this analysis indicates that we CAN capture defensive skill through observed results in the appropriate context.
In the next posting I will provide a link to the final results for the 2012-13 season, and provide a more detailed analysis of the Leafs defensive situation. Comments are welcome, and contact me on Twitter if you have any questions.


Comment Navigation & Markdown
Navigation
cc to focus on comments section
c next comment
x previous comment
z next unread comment
Inline Styles
Bold: **Text**
Italics: *Text*
Both: ***Text***
Strikethrough: ~~Text~~
Code: `Text` used as sarcasm font at PPP
Spoiler: !!Text!!