

The Leafs need defenders, and as seems to always happen, the first place anyone looks is the Carolina Hurricanes. This is a reasonable thing to do, as they are one of the best teams at, well, everything but scoring goals. Getting good results from defenders is their super power, though.
I've been looking at free agent defence, and I keep stumbling over the Hurricanes' usual list of expiring players. I say usual, because the team is unusual in their business practices, and they tend to let players run up to free agency in groups and then decide who to keep.
Carolina isn't just unusual in the business side of the game, they play weird. There is no team that has their record in recent years, and no team that got it the way they do.
Team Five-on-Five Results Since 2018
| Name | Team | GF% | CF% | xGF% | GF/60 | GA/60 | Sh% | Sv% |
|---|---|---|---|---|---|---|---|---|
| Hurricanes | CAR | 54.49 | 57.51 | 55.92 | 2.61 | 2.18 | 7.78 | 91.82 |
| Golden Knights | VGK | 53.04 | 52.21 | 53.64 | 2.68 | 2.37 | 8.33 | 91.69 |
| Bruins | BOS | 57.26 | 52.66 | 53.54 | 2.64 | 1.97 | 8.16 | 92.85 |
| Maple Leafs | TOR | 54.52 | 52.49 | 53.48 | 2.94 | 2.45 | 9.21 | 91.59 |
| Avalanche | COL | 55.54 | 53.58 | 52.93 | 2.84 | 2.27 | 8.58 | 92.2 |
| Stars | DAL | 51.84 | 50.92 | 52.77 | 2.33 | 2.17 | 7.84 | 92.42 |
| Flames | CGY | 52.3 | 53.81 | 52.74 | 2.68 | 2.44 | 8.31 | 91.35 |
| Panthers | FLA | 53.47 | 53.79 | 52.64 | 2.8 | 2.43 | 8.27 | 91.69 |
| Wild | MIN | 52.19 | 49.88 | 52.5 | 2.58 | 2.36 | 8.72 | 91.89 |
| Penguins | PIT | 52.83 | 51.57 | 52.34 | 2.69 | 2.4 | 8.3 | 92.05 |
| Oilers | EDM | 50.55 | 51.31 | 52.07 | 2.61 | 2.56 | 8.48 | 91.42 |
| Lightning | T.B | 53.58 | 52.11 | 52.04 | 2.79 | 2.42 | 9.22 | 91.72 |
| Kings | L.A | 48.82 | 51.58 | 50.86 | 2.29 | 2.4 | 7.43 | 91.46 |
| Devils | N.J | 47.53 | 49.84 | 50.73 | 2.52 | 2.79 | 8.31 | 90.87 |
| Predators | NSH | 52.11 | 50.39 | 50.38 | 2.5 | 2.3 | 8.18 | 92.48 |
| Islanders | NYI | 52.62 | 47.87 | 50.31 | 2.42 | 2.18 | 8.42 | 92.77 |
| Kraken | SEA | 50.65 | 51.37 | 50.07 | 2.53 | 2.46 | 8.79 | 91.03 |
| Capitals | WSH | 51.54 | 49.7 | 49.37 | 2.69 | 2.53 | 9.23 | 91.41 |
| Flyers | PHI | 47.11 | 48.62 | 49.08 | 2.45 | 2.75 | 8.28 | 90.88 |
| Jets | WPG | 52.06 | 49.99 | 48.91 | 2.46 | 2.26 | 8.25 | 92.56 |
| Canadiens | MTL | 48.59 | 49.45 | 48.62 | 2.5 | 2.64 | 8.3 | 91.43 |
| Senators | OTT | 45.06 | 47.89 | 48.37 | 2.37 | 2.88 | 8.02 | 91.02 |
| Blues | STL | 51.33 | 48.25 | 48.12 | 2.56 | 2.42 | 8.88 | 91.87 |
| Rangers | NYR | 50.85 | 48.06 | 48.09 | 2.5 | 2.41 | 8.65 | 92.02 |
| Canucks | VAN | 49.5 | 48.65 | 47.9 | 2.48 | 2.53 | 8.64 | 91.75 |
| Sharks | S.J | 43.33 | 47.8 | 47.79 | 2.3 | 3.01 | 8.1 | 90.23 |
| Sabres | BUF | 46.77 | 49 | 47.19 | 2.42 | 2.75 | 8.2 | 91.24 |
| Coyotes | ARI | 45.99 | 46.5 | 46.75 | 2.28 | 2.67 | 8.33 | 91.58 |
| Blue Jackets | CBJ | 45.8 | 47.2 | 46.59 | 2.4 | 2.85 | 8.2 | 91.29 |
| Red Wings | DET | 43.64 | 45.35 | 45.34 | 2.18 | 2.82 | 8.15 | 91.19 |
| Ducks | ANA | 43.8 | 45.8 | 44.69 | 2.14 | 2.75 | 7.88 | 91.57 |
| Blackhawks | CHI | 43.55 | 45.33 | 44.17 | 2.22 | 2.87 | 8.01 | 91.47 |
They dominate the league most seasons in Corsi and Expected Goals. They have a good goal-scoring record, but not as dominating. They score less than the other good teams, they allow less as well. They have a low Shooting % and a just okay Save %.
Last season there was an article published that claimed that the Maple Leafs' entire defensive system is what I've taken to calling Corsi-affecting defence. That is, plays involving puck control, retrieval and possession that allow the team to shoot more than they allow. I think that was an exaggerated view of the Leafs, but it seems to be the underlying principle of the Hurricanes entire system.
There are benefits to this system. You can have the revolving door on the goal crease and keep trying until you get a goalie who is producing well this year. It's almost like there's someone in that team's front office who deeply grasps the implications of what it means that goalies are impossible to predict. You can also, it seems, have less raw offensive talent then that loser team that leads the GF/60 list.
In the playoffs, their system also tends to put them high up in the standings, and they often play wild card teams or the weakest Metro team in the playoffs. They do the hot knife through butter routine in the first round a lot, and get beat in the second round just as easily. They got to the Conference Finals once because somehow the Islanders made it to the second round to be swept. The Islanders are the team they beat the easiest, and that defence-first routine Lou Lamoriello likes dies in the light of Carolina's system.
However, I think scoring goals is really important, and Carolina keeps forgetting to do that enough. Given that, it's natural to consider the Carolina system just with the Leafs offensive skill as the ideal. But it's not that simple because the Carolina system actively works against offensive power. They are the weirdest team in the NHL.
Five-on-Five Individual Shooting by Defenders as a % of the Total: 2023-2024
| Team | iCF by Defenders |
|---|---|
| CAR | 41.61% |
| COL | 38.79% |
| VAN | 38.04% |
| NYI | 37.41% |
| VGK | 37.36% |
| S.J | 37.29% |
| NSH | 36.16% |
| SEA | 35.93% |
| CGY | 35.78% |
| FLA | 35.77% |
| PIT | 35.52% |
| EDM | 35.50% |
| OTT | 35.40% |
| STL | 34.60% |
| WSH | 34.39% |
| CBJ | 34.20% |
| DAL | 33.96% |
| WPG | 33.79% |
| DET | 33.72% |
| NYR | 32.85% |
| MTL | 32.67% |
| T.B | 32.61% |
| CHI | 32.55% |
| BOS | 32.09% |
| N.J | 32.03% |
| MIN | 31.71% |
| PHI | 31.70% |
| ARI | 31.67% |
| ANA | 31.21% |
| BUF | 29.68% |
| L.A | 29.27% |
| TOR | 27.30% |
Or the Leafs are, depending on how you sort the table. I would caution against leaping to some half-baked (not even half) eureka moment by trying to find a correlation to team success from one season of one measure of one aspect of a team's play.
Carolina's extraordinary high level of defender shots is part of a system of location choices for shooting that no one else uses, although the Islanders ended up with a very weak version this year as two different coaches tried to make them score goals.
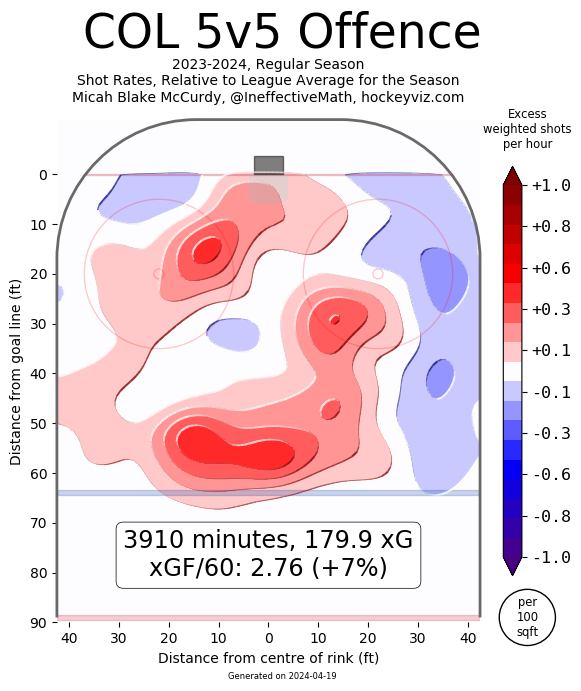
Most teams with talented defenders tend to look more like Colorado:
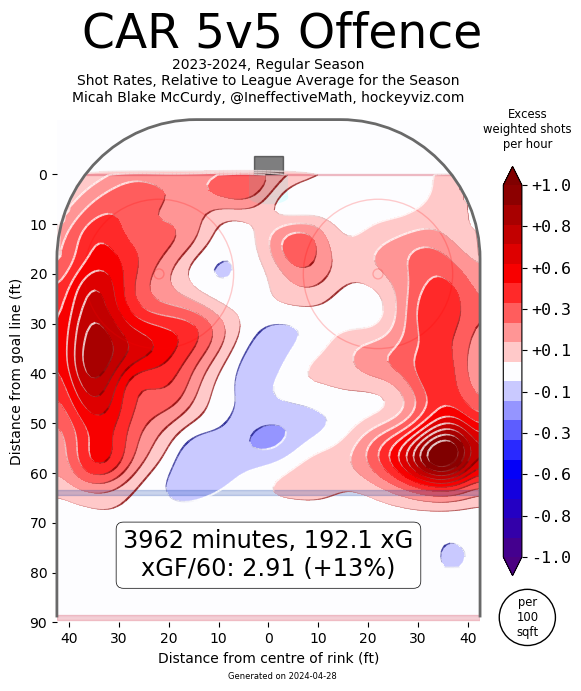
High percentages of shots from defenders are only part of the story for Carolina. The heavy emphasis on point shots is like a weird throwback to the days of stand-up goalies and no shot-blocking. But the thing to remember about Carolina is that their rate of Corsi For is so much higher than everyone else's that they still get the highest rate of Expected Goals For shooting from where they do. The biggest component of Expected Goals is volume, not quality.
However, Carolina does not get the same goal rate as other good Expected Goals teams as we saw above. They are 11th in this period, which is almost 500 games, which means I'm not hesitant to look at goal scoring to find meaning. Defenders are rarely as good at shooting the puck as forwards, so they are cutting down on their shooting percentage somewhat just by who is shooting.
I took all the skaters in the NHL this year and calculated from them the team-based five-on-five Fenwick Shooting % (so the % of all unblocked shots that are goals) and the Expected version of the same thing (so the % of all unblocked shots that are expected goals). This tells you who should be scoring goals and who actually does.
Carolina is the fifth lowest team at Expected Shooting %, and the third worst at actual Shooting %. The only teams worse than them are Chicago and San Jose. Toronto is seventh and third, so they actually shot over expected as a team this season. But the margin is pretty tiny and amounts to 8.5 goals. Carolina got 28 goals less than expected. That number is skill of shooters and randomness all mixed in with their system.
Another reason why their system cuts into the goal rate vs expected rate is that a lot of that tasty-looking xG is made up of lots of low percentage chances, and there is a serious question to be had about whether piling up a bunch of tiny fractional chances really matches a few high percentage shots that come out to the same total number of Expected Goals. Goals don't come in fractions.
The Defence
I think you have to really understand Carolina's uniqueness and how dramatically far away they are from anything Toronto could produce with their personnel before you seriously imagine their defenders on the Leafs. Even then, players do what their team asks them to do. They don't do the things their coach frowns on. So on the Leafs any of the Carolina defenders may play differently.
Who are they? Well, they ended the season playing a fairly regular six-man structure where the pairs were very static. At the beginning of the year, Dmitry Orlov was paired with Tony DeAngelo while Brett Pesce was out for a few games. DeAngelo vanished, and Jalen Chatfield took over. The pairs were Jaccob Slavin and Brett Pesche plus Brent Burns and Brady Skjei who all played over 20 minutes in all situations. The third pair was Orlov and Chatfield for most of the season, and they averaged 17 and 15 respectively.
So the first thing you have to understand is that their highest paid defender, Orlov, was on the third pair, and also, played less than is normal against top forward lines. The second thing is that the Hurricanes were one of the few teams in the NHL to have a legitimate top-four and third-pair arrangement, and they also had one of the best third pairs in the NHL.
When looking at defenders for UFAs I like, I chose Evolving Hockey's RAPM tables which adjust on-ice measures like Expected Goals Against for things like teammates, competition, zones, etc. Out of the 310 defenders in the NHL with at least 50 minutes played at even-strength, by xGA per 60, the Carolina crew ranks:
- Chatfield: 38th
- Orlov: 42nd
- Slavin: 45th
- Burns: 80th
- Skjei: 101st
- Pesce: 159th
Which means that no one is a star, but no one is bad. Morgan Rielly, for reference, is 282nd. The differences between the entire six-man corps are not large and everyone was a success. Why would you get rid of any of them? Orlov, Burns and Slavin are UFA next summer, and Slavin is their franchise player so he's not going anywhere. Burns and Orlov are a different story, but why would you let Skjei and Pesce go just because they need a raise? Carolina seems to balk at that, but if I'm their GM, whoever that ends up being, I would look at the efficiency of the cap dollars spent and trade Orlov if space was at a premium.
They have a lot of RFA forwards to sign and the rumours are rife they will trade Martin Necas instead of signing him, so I'm not absolutely sure they even have a tight cap with regard to the defenders.
I'll look at these players in a little more depth with the free agent post in the coming days, but I doubt any of them are walking other than DeAngelo and Chatfield. I also can't really imagine how well any of them would play in Toronto, a team many people mistakenly think is just like the Hurricanes.


Comment Navigation & Markdown
Navigation
cc to focus on comments section
c next comment
x previous comment
z next unread comment
Inline Styles
Bold: **Text**
Italics: *Text*
Both: ***Text***
Strikethrough: ~~Text~~
Code: `Text` used as sarcasm font at PPP
Spoiler: !!Text!!