
Randy Carlyle is considered a defensive guru around NHL circles. The media are impressed with his Stanley Cup attained on the shoulders of defensive gems like Niedermayer and Pronger, and somehow overlook the ridiculously good goaltending his Ducks teams had in making it to the Stanley Cup. How is it ridiculous to assert that Carlyle is a good defensive coach while Wilson was a poor one, particularly when the Leafs are showing such improvement you say? Well - to be blunt - very.
Let's take a look at some of the numbers to see if there's really any veracity to the claims that Carlyle's "systems" are making the Leafs a sturdier defensive outfit.
First off - let us look at the claims that somehow Carlyle has shored up the Leafs shots from the inside vs. shots from the outside. Earlier in the season, James Mirtle of the Globe and Mail wrote a piece that praised Carlyle for employing a similar defensive scheme that has been used historically by Jacques Lemaire in New Jersey. Mark Fraser - who spent a number of years in the Devils organization - claimed that it was extremely effective there, and that working his way into it was easy because he found it so familiar.
What do the numbers say about actual results? Well - frankly there's no doubt in my mind that Carlyle's defensive scheme is at the minimum no improvement over Ron Wilson's in terms of where shots are being allowed from. Secondarily, I actually feel there is a solid chance that Carlyle's system is possibly worse in terms of shots allowed at dangerous distances.
Ok - so using Greg Sinclair's Super Shot Search to assess shot distances allowed at ES and on the PK, I explored Carlyle's last 3 full seasons in Anaheim, Wilson's last 3 full seasons in Toronto, and then what Carlyle has managed thus far this season. Unsurprisingly, there are some contradictions in the results.
The following graph shows shot attempts against at Even Strength from 2008-09 through 2010-11 for the Leafs and the Ducks in away games only (to minimize score keeping affects). Those are the last 3 full seasons Wilson and Carlyle each had with those respective teams. Anaheim is in purple, the Leafs are in blue.
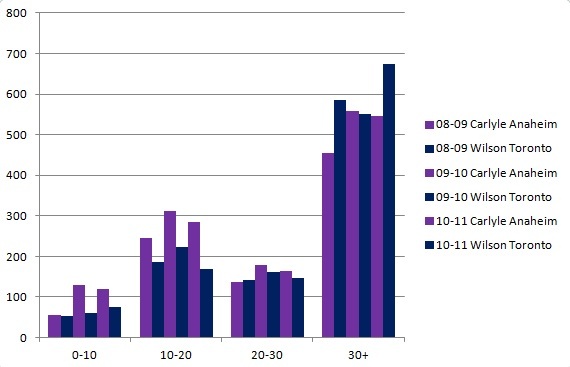
You'll notice that the Purple lines are higher in the brackets on the left, from 0 to 10 feet and from 10 to 20 feet. That's because Carlyle's Duck outfits regularly allowed MORE shots than Wilson's Leaf outfits from inside 20 feet. In fact, the most dangerous shooting area is the 10-20 foot range. Shooting percentages here typically approach 20-25% at the league level. In other words, Randy's teams sure did allow a lot of shots from dangerous spots on the ice. You'll also notice that Wilson's largest two bars (the largest two on the graph) show up in the 30+ foot area.
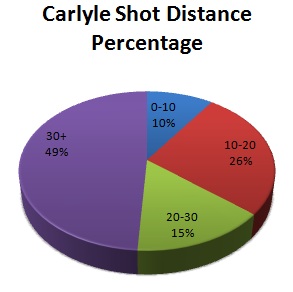
Here are two more graphs that illustrate on a percentage basis how Wilson and Carlyle's teams fared in this regard over this 3 season stretch of hockey.
And now for Ron Wilson's comparable graph with the Leafs from 2008-09 through 2010-11:
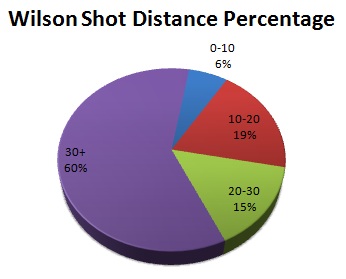
You may notice something different between the two pie charts - namely that Wilson's Leafs tenure was far more noted for pushing shots at ES outside 30 feet than Carlyle's Ducks tenure. This frankly makes it curious that anyone, anywhere credits Carlyle's defensive scheming for having such an effect, while at the same time criticizing Wilson's Leafs for lacking an ability to do so.
On another note, I find it intriguing that people will invent or construct explanations for luck based phenomena. Wilson's Leaf teams were actually quite good at pushing shots to the outside and preventing them from in close. It's not his fault the goaltending behind his players was atrocious.
Ironically this may lead to a debate around "fronting" and Wilson's use of the shot blocking tactic. Firstly, I am not sold on the idea that the Leafs were particularly effective at blocking or tipping shots, but that is neither here nor there. Secondarily, it is often asserted that the attempt by the D men to block shots often results in screens that damage a goaltender's ability to track shots from the point, thus lowering SV% on long distance shots.
Again - we have an issue with what the data actually shows between the two coaches results. Here are the save percentages for Wilson and Carlyle's teams at even strength during the tenure covered above:
| ES Data | SV% | |||||
|---|---|---|---|---|---|---|
| Season | Coach | Team | 0-10 | 10-20 | 20-30 | 30+ |
| 08-09 | Carlyle | Anaheim | 0.821 | 0.824 | 0.941 | 0.954 |
| 08-09 | Wilson | Toronto | 0.846 | 0.778 | 0.860 | 0.966 |
| 09-10 | Carlyle | Anaheim | 0.907 | 0.891 | 0.893 | 0.952 |
| 09-10 | Wilson | Toronto | 0.917 | 0.857 | 0.914 | 0.955 |
| 10-11 | Carlyle | Anaheim | 0.883 | 0.873 | 0.921 | 0.958 |
| 10-11 | Wilson | Toronto | 0.867 | 0.799 | 0.891 | 0.954 |
There appears to be little separation between the save percentages observed for the Leafs goalies and the Ducks goalies at a shot distance beyond 30 feet, and while Wilson's goaltending was better in close within 10 feet, (perhaps a credit to Francois Allaire's blocking style down low) it appears the main struggle for the Leafs was on shots between 10 and 30 feet, not shots from the point. This largely speaks to the issues with Jonas Gustavsson and Vesa Toskala during this time frame to play consistently. The Ducks were largely seeing Jonas Hiller between the pipes over this stretch so his numbers helped defray Carlyle's ineffective tactics in Anaheim.
Lastly I would like to compare the coaches results and systems in this regard on the PK. Wilson's penalty killing units were regularly abysmal, so first lets look and see if shot totals had something to do with it. Again using away game data only, here are the shot totals and percentages of the total based on distance for both Anaheim and Toronto from 08-09 through the 10-11 season:
| PK Data | Shots | Percentage | ||||||||
|---|---|---|---|---|---|---|---|---|---|---|
| Season | Coach | Team | 0-10 | 10-20 | 20-30 | 30+ | 0-10 | 10-20 | 20-30 | 30+ |
| 08-09 | Carlyle | Anaheim | 19 | 96 | 41 | 149 | 6.23% | 31.48% | 13.44% | 48.85% |
| 09-10 | Carlyle | Anaheim | 32 | 78 | 29 | 128 | 11.99% | 29.21% | 10.86% | 47.94% |
| 10-11 | Carlyle | Anaheim | 15 | 48 | 26 | 86 | 8.57% | 27.43% | 14.86% | 49.14% |
| Total | Carlyle | Anaheim | 66 | 222 | 96 | 363 | 8.84% | 29.72% | 12.85% | 48.59% |
| 08-09 | Wilson | Toronto | 18 | 75 | 29 | 100 | 8.11% | 33.78% | 13.06% | 45.05% |
| 09-10 | Wilson | Toronto | 20 | 59 | 34 | 94 | 9.66% | 28.50% | 16.43% | 45.41% |
| 10-11 | Wilson | Toronto | 13 | 30 | 18 | 86 | 8.84% | 20.41% | 12.24% | 58.50% |
| Total | Wilson | Toronto | 51 | 164 | 81 | 280 | 8.85% | 28.47% | 14.06% | 48.61% |
What stands out to me here is, over a 3 year term, both coaches implemented systems that seemed to push a virtually identical percentage of power play shots out past 30 feet, and allowed a virtually identical percentage inside 10 feet (48.6% and 8.85% of shots against respectively). I haven't explored the data for every NHL franchise for the same time frame, but the numbers are so close together that I am curious if the range for the entire league is as narrow as it appears at first blush.
While the 3 year term seems comparable, it seems obvious that year over year, major swings did take place. Wilson's Leaf squads in particular show drastic improvement from the 08-09 season through the 10-11 year. They went from a team surrendering a third of the shots against it on the PK in the dangerous 10-20 foot range, to allowing only 20% in that range in 2010-11. Interestingly, most of that shift appeared to come from forcing shots to the outside as the percentage beyond 30 feet rose from roughly 45% to over 58%.
Then came last season - the final nail in the proverbial coffin for Wilson was likely the team's continued struggles on the Penalty Kill. The shot totals shifted again, though on the road they weren't that bad. Using the road data solely the proportion of those taken under 10 feet was only 5.37% of those allowed. The percentage in the 10 to 20 foot range crept back up to 24.06%, while the percentage at 20 to 30 remained typical at 14.77%, and the point shot percentage (30+ ft) dropped slightly to 55.70%.
It largely appears that the percentage of shots on the PK taken from in close caused a large part of the Leafs issues last season though - particularly at home. Giving up 8 goals on 30 close range shots on home ice on the PK sank the Leafs percentages fairly horribly.
How has Carlyle's system impacted the Leafs thus far this season? Well at even strength and on the penalty kill their numbers thus far are shown below:
| Shots | Percentage | |||||||
|---|---|---|---|---|---|---|---|---|
| Sit | 0-10 | 10-20 | 20-30 | 30+ | 0-10 | 10-20 | 20-30 | 30+ |
| ES | 33 | 93 | 74 | 280 | 6.88% | 19.38% | 15.42% | 58.33% |
| PK | 3 | 20 | 11 | 54 | 3.41% | 22.73% | 12.50% | 61.36% |
So far the percentages do seem to be maintaining at even strength, though not particularly improved. Generally they appear comparable to that observed under Wilson. On the PK though, the reduction in shots in close from 0 to 10 feet is impressive, and the slight up-tick in shots outside 30 feet may compensate for the slight increase in 10 to 20 foot attempts.
At this stage I would caution that the sample size is small, and we have yet to see if Carlyle's "systems" really are having an impact on the PK. His prior history would suggest to me that his role is limited, and frankly I would expect to chalk more of what we're observing up to personnel. Jay McClement, Mark Fraser, Nikolai Kulemin, and Mikhail Grabovski all have a defensive skill set that is seeing more use in short handed situations. This could likely contribute to the improved save percentages the Leafs are observing at least in penalty killing situations.
Maintaining this kind of distribution long term might indicate a change in tactics on Carlyle's part from the methods he employed in Anaheim, in which case it would be nice to observe the trend continuing. Revisiting this topic at the season's halfway point will likely provide us with more insight to whether or not there is an impact.
Randy Carlyle has not significantly altered the Leafs play at even strength. This is the area that they are most improved in from a results perspective. Their save percentage and shooting percentages are both high and largely explain the results we have observed so far. PDO regresses over time, and we should expect thing to shift for the Leafs in a negative direction long term. Keeping those shots to the outside should minimize the damage, but the Leafs need to hope they get improvement rather than just luck going forwards.


Comment Navigation & Markdown
Navigation
cc to focus on comments section
c next comment
x previous comment
z next unread comment
Inline Styles
Bold: **Text**
Italics: *Text*
Both: ***Text***
Strikethrough: ~~Text~~
Code: `Text` used as sarcasm font at PPP
Spoiler: !!Text!!