

Playoffs are here!
Schedule
| DATE | AWAY | HOME | GAME | TIME (ET) | NETWORK |
|---|---|---|---|---|---|
| Wednesday, May 8, 2024 | Minnesota | Toronto | 1 | 7pm | TSN4/5 |
| Thursday, May 9, 2024 | Boston | Montreal | 1 | 7pm | TSN1/5 |
| Friday, May 10, 2024 | Minnesota | Toronto | 2 | 7pm | TSN3/4 |
| Saturday, May 11, 2024 | Boston | Montreal | 2 | 7pm | TSN4 |
| Monday, May 13, 2024 | Toronto | Minnesota | 3 | 8pm | TSN5 |
| Tuesday, May 14, 2024 | Montreal | Boston | 3 | 7pm | TSN3 |
| Wednesday, May 15, 2024 | Toronto | Minnesota | 4 | 8pm | TSN4 |
| Thursday, May 16, 2024 | Montreal | Boston | 4 | 7pm | TSN3/5 |
| Friday, May 17, 2024 | Minnesota | Toronto | 5 | 7pm | TSN5 |
| Sunday, May 19, 2024 | Boston | Montreal | 5 | 7pm | TSN1/4 |
All games should be on YouTube as well. All YouTube streams were available worldwide during the regular season.
Toronto's home games will be at Coca-Cola Coliseum, and the first two games sold out in minutes. Montréal's games will be at Place Bell in Laval and there are very limited numbers of tickets left.
Regular Season
With all 72 games over, the final league averages give a picture of how PWHL hockey looks in general.
| GP | G | PPG | SHG | PPO | PP% | PK% | JB% | SA | SH% | SV | SV% | GAA |
|---|---|---|---|---|---|---|---|---|---|---|---|---|
| 72 | 2.38 | 0.48 | 0.09 | 2.83 | 0.17 | 0.83 | 0.03 | 28.75 | 0.08 | 26.52 | 0.922 | 2.23 |
Glossary for League Averages
Most stats are per game, per team
GP: Games Played - total for league
G: Goals - does not include shootout winners, does include ENG
PPG: Power Play Goals
SHG: Shorthanded Goals
PPO: Power Play Opportunities
PP%: Power Play Success %
PK%: Penalty Kill Success %
JB%: Jailbreak Success % - a jailbreak is the PWHL term for ending a power play by scoring shorthanded
SA: Shots Against
SH%: Shooting %
SV: Saves
SV%: Save % - does not include ENG or shootout winners
GAA: Goals Against Average - does not include ENG
Without empty net goals (the GAA), the PWHL scores just over two goals per game. The NHL was at 2.91 this year. The most obvious difference between the two elite pro leagues is the overall PP and PK percentages. The NHL has had a PK% of 80 +/- 2 for 19 years. In 2004, the NHL last had a PK% over 83. Goalie results have actually gotten better overall in the NHL since then, but the PK% did not rise much with those increases in Save %.
The success percentages on special teams are tied to overall goaltending, but not just determined by the goalies. The NHL has never had an average Save % as high a .922, so considering that gaudy Save %, the PWHL power plays average out to be better than they appear while most teams' penalty kills are heavily dependent on goalies.
Oh, and as for the pace of the game, the PWHL averages 1.25 shots on goal per game per team less than the NHL. The PWHL is tilted towards goalies right now. Something expansion is going to fix quite easily in time.
By team, we can see who is average and who isn't.
| Team Name | GP | GF | GA | PPG | PPGA | SHG | SHGA | ENG | ENGA | PPO | PPA | SA | SV | SF | SH% | SV% | Name |
|---|---|---|---|---|---|---|---|---|---|---|---|---|---|---|---|---|---|
| Boston | 24 | 2.04 | 2.33 | 0.17 | 0.54 | 0.08 | 0.04 | 0.04 | 0.17 | 2.21 | 2.71 | 27.50 | 25.33 | 28.92 | 0.07 | 0.921 | Boston |
| Minnesota | 24 | 2.17 | 2.25 | 0.21 | 0.83 | 0.08 | 0.00 | 0.08 | 0.08 | 2.54 | 2.54 | 26.21 | 24.04 | 30.58 | 0.07 | 0.917 | Minnesota |
| Montreal | 24 | 2.50 | 2.29 | 0.54 | 0.50 | 0.04 | 0.17 | 0.12 | 0.21 | 3.42 | 3.12 | 30.46 | 28.38 | 27.88 | 0.09 | 0.932 | Montreal |
| New York | 24 | 2.21 | 2.75 | 0.79 | 0.38 | 0.08 | 0.12 | 0.08 | 0.17 | 3.25 | 2.92 | 33.42 | 30.83 | 27.83 | 0.08 | 0.923 | New York |
| Ottawa | 24 | 2.54 | 2.54 | 0.67 | 0.38 | 0.12 | 0.12 | 0.25 | 0.17 | 2.67 | 2.67 | 27.83 | 25.46 | 30.04 | 0.08 | 0.915 | Ottawa |
| Toronto | 24 | 2.79 | 2.08 | 0.50 | 0.25 | 0.12 | 0.08 | 0.29 | 0.08 | 2.92 | 3.04 | 27.08 | 25.08 | 28.12 | 0.10 | 0.926 | Toronto |
I bet you had Toronto pegged to get the highest SH% in the league back in January.
Toronto scores the most goals, but they don't have the most SF (Shots on Goal For). That's actually Minnesota. Toronto ended up with just slightly above league average goaltending, and Minnesota ended up below. That's not how the season started, though, as we all likely remember.
Minnesota has trouble scoring, and that's been their issue more than the merely okay goaltending.
Toronto and Montréal are the only teams that averaged more goals scored than they allowed. That's how tight the margins are in this league. Minnesota is very close, though. And for all they came fourth and have had a lot of losses lately, I'd rate them the tougher opponent than Boston.
If you look at power play opportunities for and against, you'll see that Toronto is almost even and Minnesota is dead even.
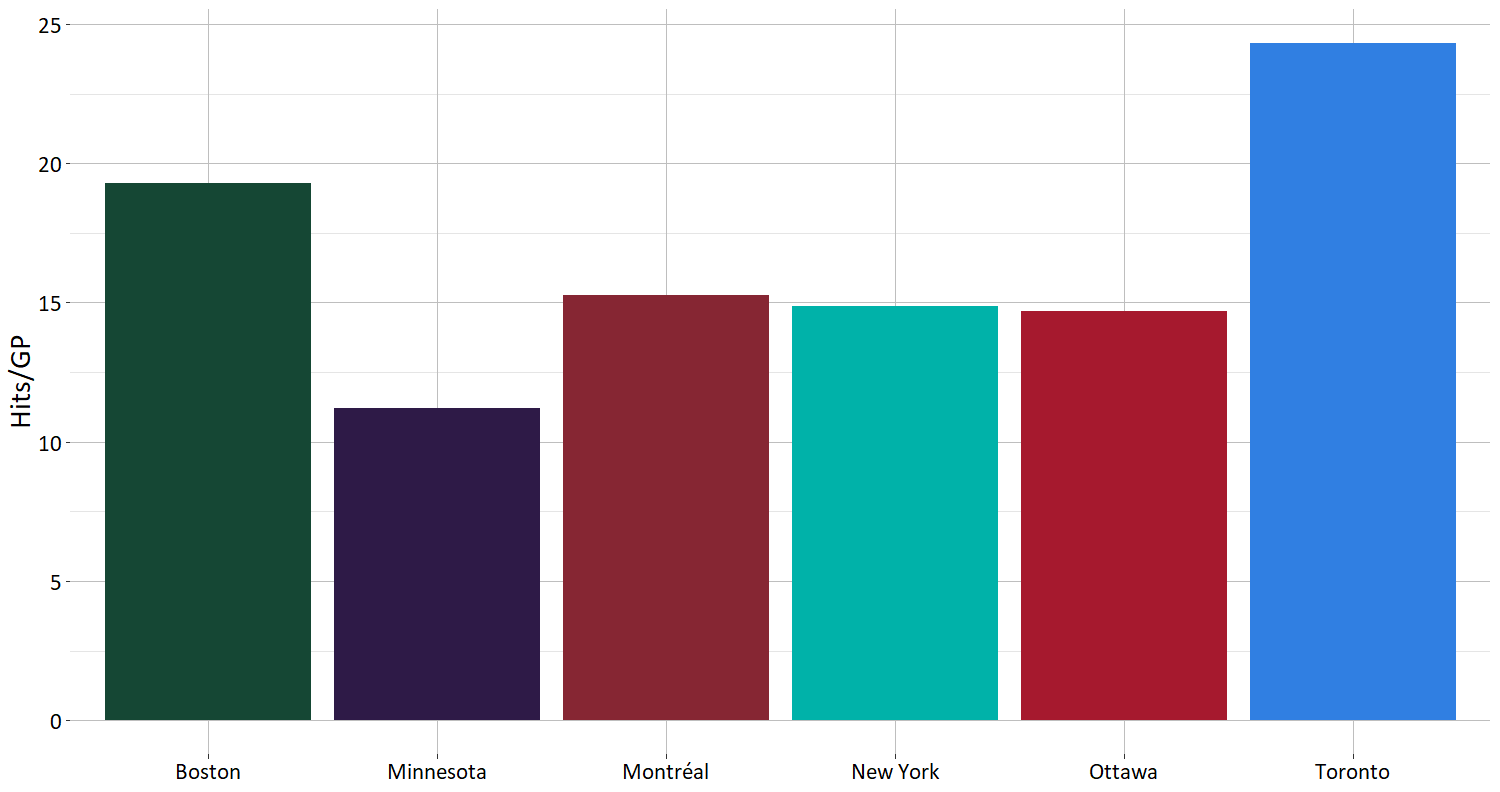
Hits
For fun, and to set your expectation on the level of physicality, this is the regular season hits per game. Note that there are only 15-17 games per team where this information was tracked, and that is the second half of the season.
Players to Watch
Natalie Spooner of course, but you know that. Toronto absolutely has a top-heavy scoring regime led by number 24 with 20 goals, tops in the league. Sarah Nurse has 11, Hannah Miller – truly the best surprise on the team – has seven, and there's a few here and there through the defence and the rest of the forwards. They have 16 goal-scorers in total but Spooner, Nurse and Emma Maltais account for the bulk of the points.
Miller is the most experience playoff performer on the team. She has 14 playoff games played in league hockey with KRS in the Russian league.
On Minnesota, the star by the goal stats is not Taylor Heise, who has two, but Grace Zumwinkle, who has 11. The team had 17 goal scorers in total, with the bulk coming from their top-six forwards, but they get a few here and there from everyone. Kendal Coyne is the most famous player on Minnesota, and she's been very good as have all of their top echelon of forwards.
The Matchup
Toronto is stronger in most areas than Minnesota, but they are a team very capable of matching Toronto's middle six with lines that can score. Minnesota, made up of a lot of Team USA players came back from Worlds on a downturn. The Team Canada infused Toronto team were flying high.
I don't think those Worlds emotions are going to bleed over into the playoffs, and we should all expect a tough fight. The goalies need to be good, but Toronto's extremely good PK should give them the special teams edge and then it's all down to who can control the puck more – something both teams are good at – and who has the scoring skill to put the puck in the net.
Go Toronto G0!


Comment Navigation & Markdown
Navigation
cc to focus on comments section
c next comment
x previous comment
z next unread comment
Inline Styles
Bold: **Text**
Italics: *Text*
Both: ***Text***
Strikethrough: ~~Text~~
Code: `Text` used as sarcasm font at PPP
Spoiler: !!Text!!