

Minnesota @ Toronto - 12:00 PM - Mattamy Athletic Centre
Broadcast: CBC, Bally Sports North
Streaming: CBC Gem, YouTube
Toronto's last game was a 2-0 regulation win over New York on January 26. Their league record is 2 RW, 1SOW and 5L in 8 GP for a Points % of 0.333.
Minnesota's last game was a 2-1 overtime win over New York on January 28. Their league record is 3 RW, 2 OTW, 2 OTL and 1L in 8 GP for a Points % or 0.625.
Will ASG break over and 22 games played, it's possible to get a little context on the PWHL from the league averages. This was very much inspired by Hockey Reference's NHL page, which I find invaluable for contextualizing team performance within the season. The PWHL's only has one row, though!
PWHL League Averages
| GP | G | PPG | SHG | PPO | PP% | PK% | JB% | SA | SH% | SV | SV% | GAA |
|---|---|---|---|---|---|---|---|---|---|---|---|---|
| 22 | 2.32 | 0.39 | 0.09 | 2.89 | 0.13 | 0.87 | 0.03 | 28.80 | 0.08 | 26.57 | 0.923 | 2.23 |
Glossary for League Averages
Most stats are per game, per team
GP: Games Played - total for league
G: Goals - does not include shootout winners, does include ENG
PPG: Power Play Goals
SHG: Shorthanded Goals
PPO: Power Play Opportunities
PP%: Power Play Success %
PK%: Penalty Kill Success %
JB%: Jailbreak Success % - a jailbreak is the PWHL term for ending a power play by scoring shorthanded
SA: Shots Against
SH%: Shooting %
SV: Saves
SV%: Save % - does not include ENG or shootout winners
GAA: Goals Against Average - does not include ENG
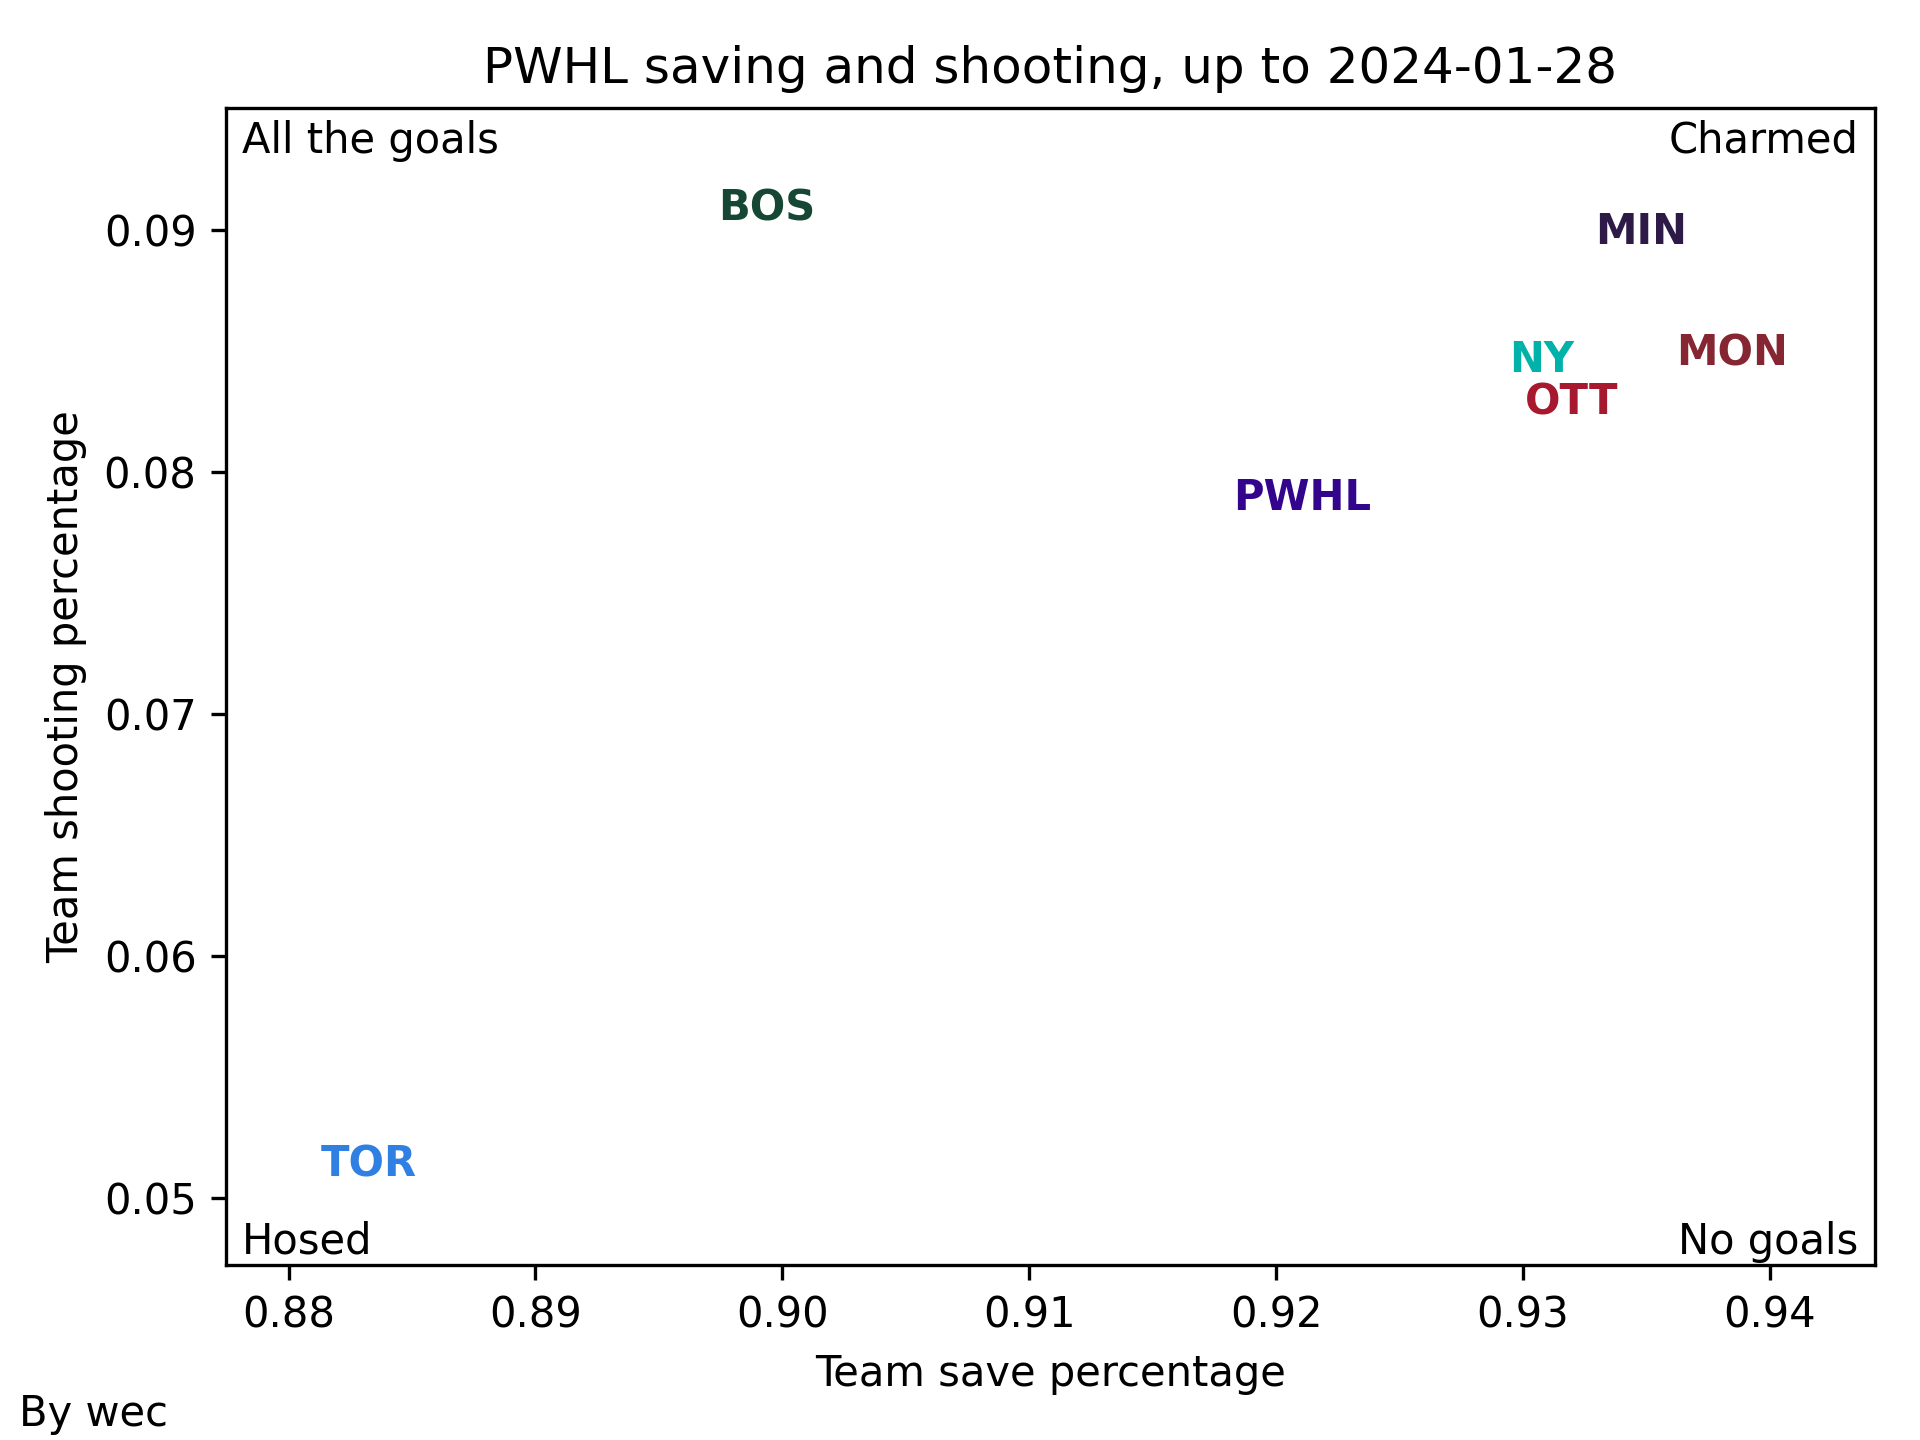
You should immediately notice the very low PP%. The NHL has never had a number that low in the modern era when that data was recorded, but they've been as low as 15% back when goaltending began to change in the 90s. That and the epic average Save % of .923 says the obvious: this is a goalies' league.
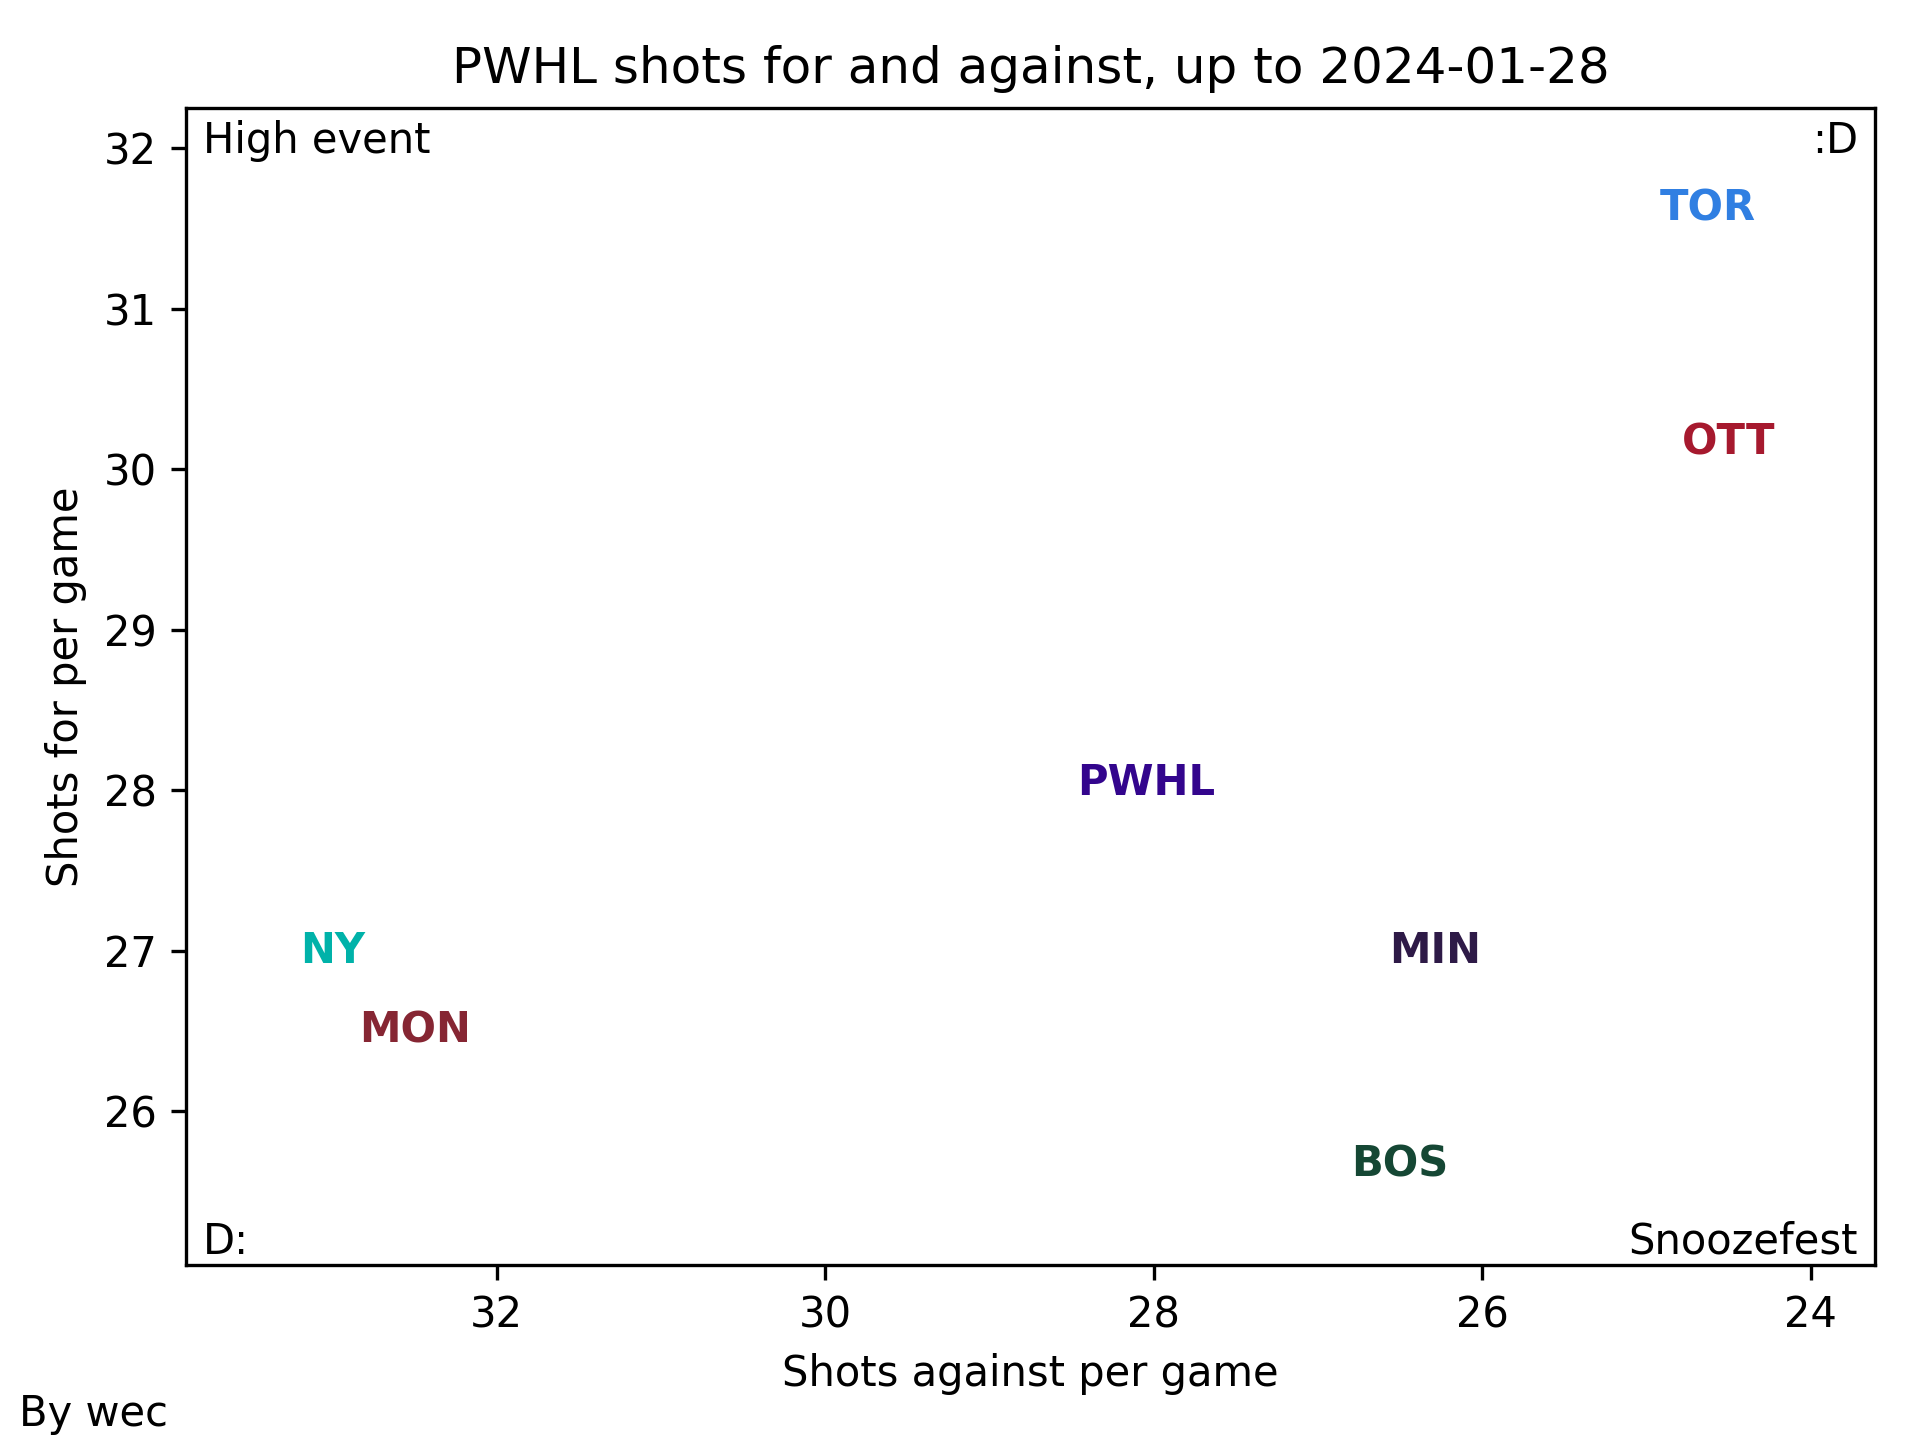
More properly, the gap between team shooting skill and goaltending is larger than in the NHL. Meanwhile the volume of shots on goal is only 1.5 per game lower than in the NHL.
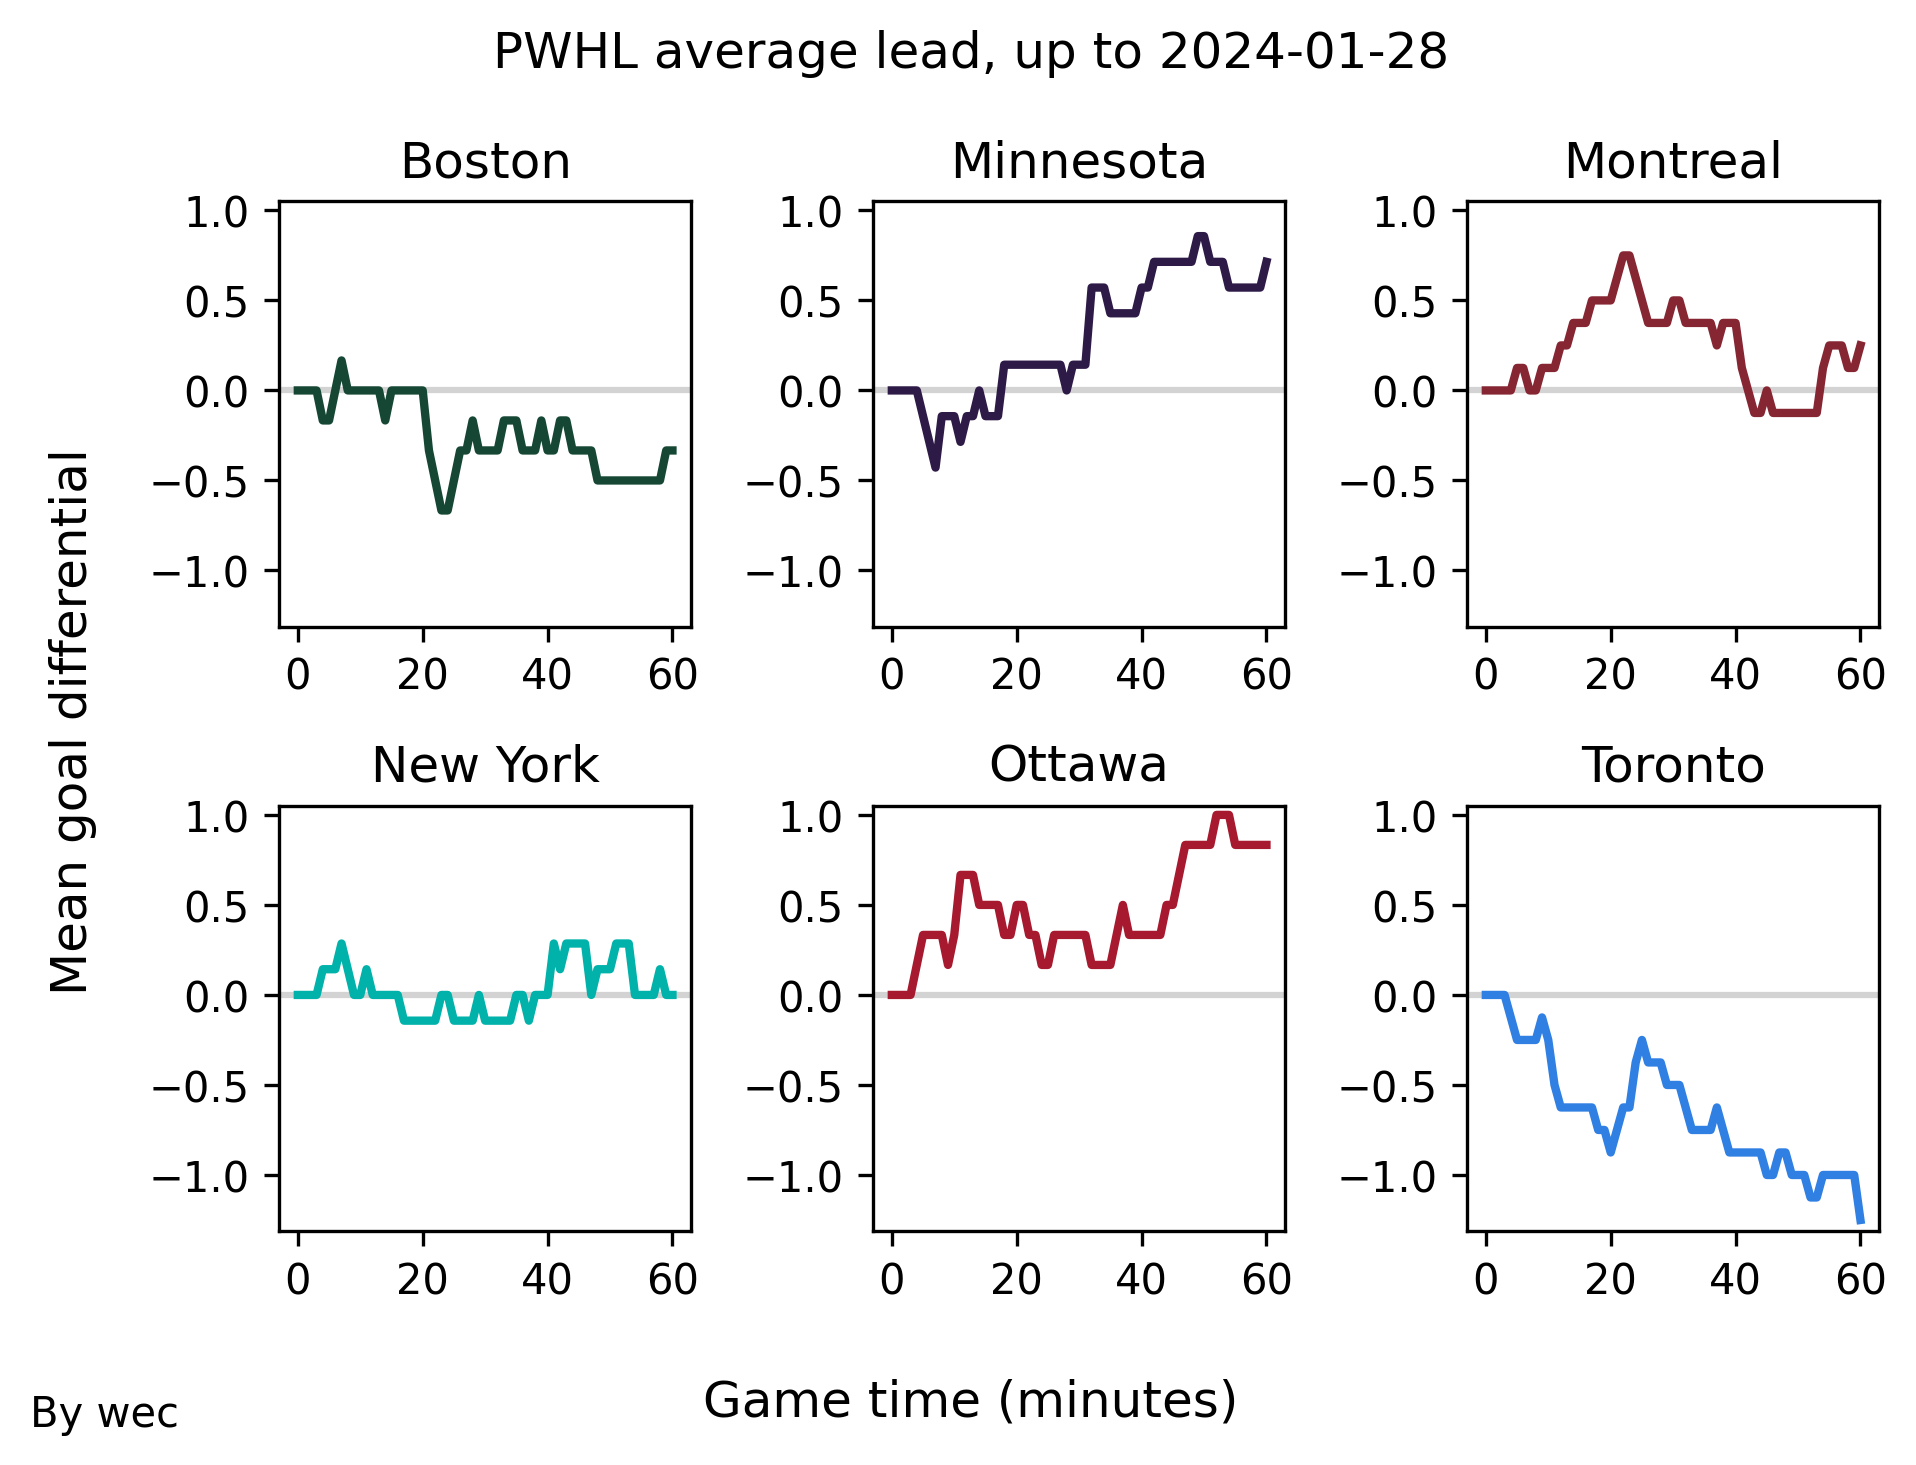
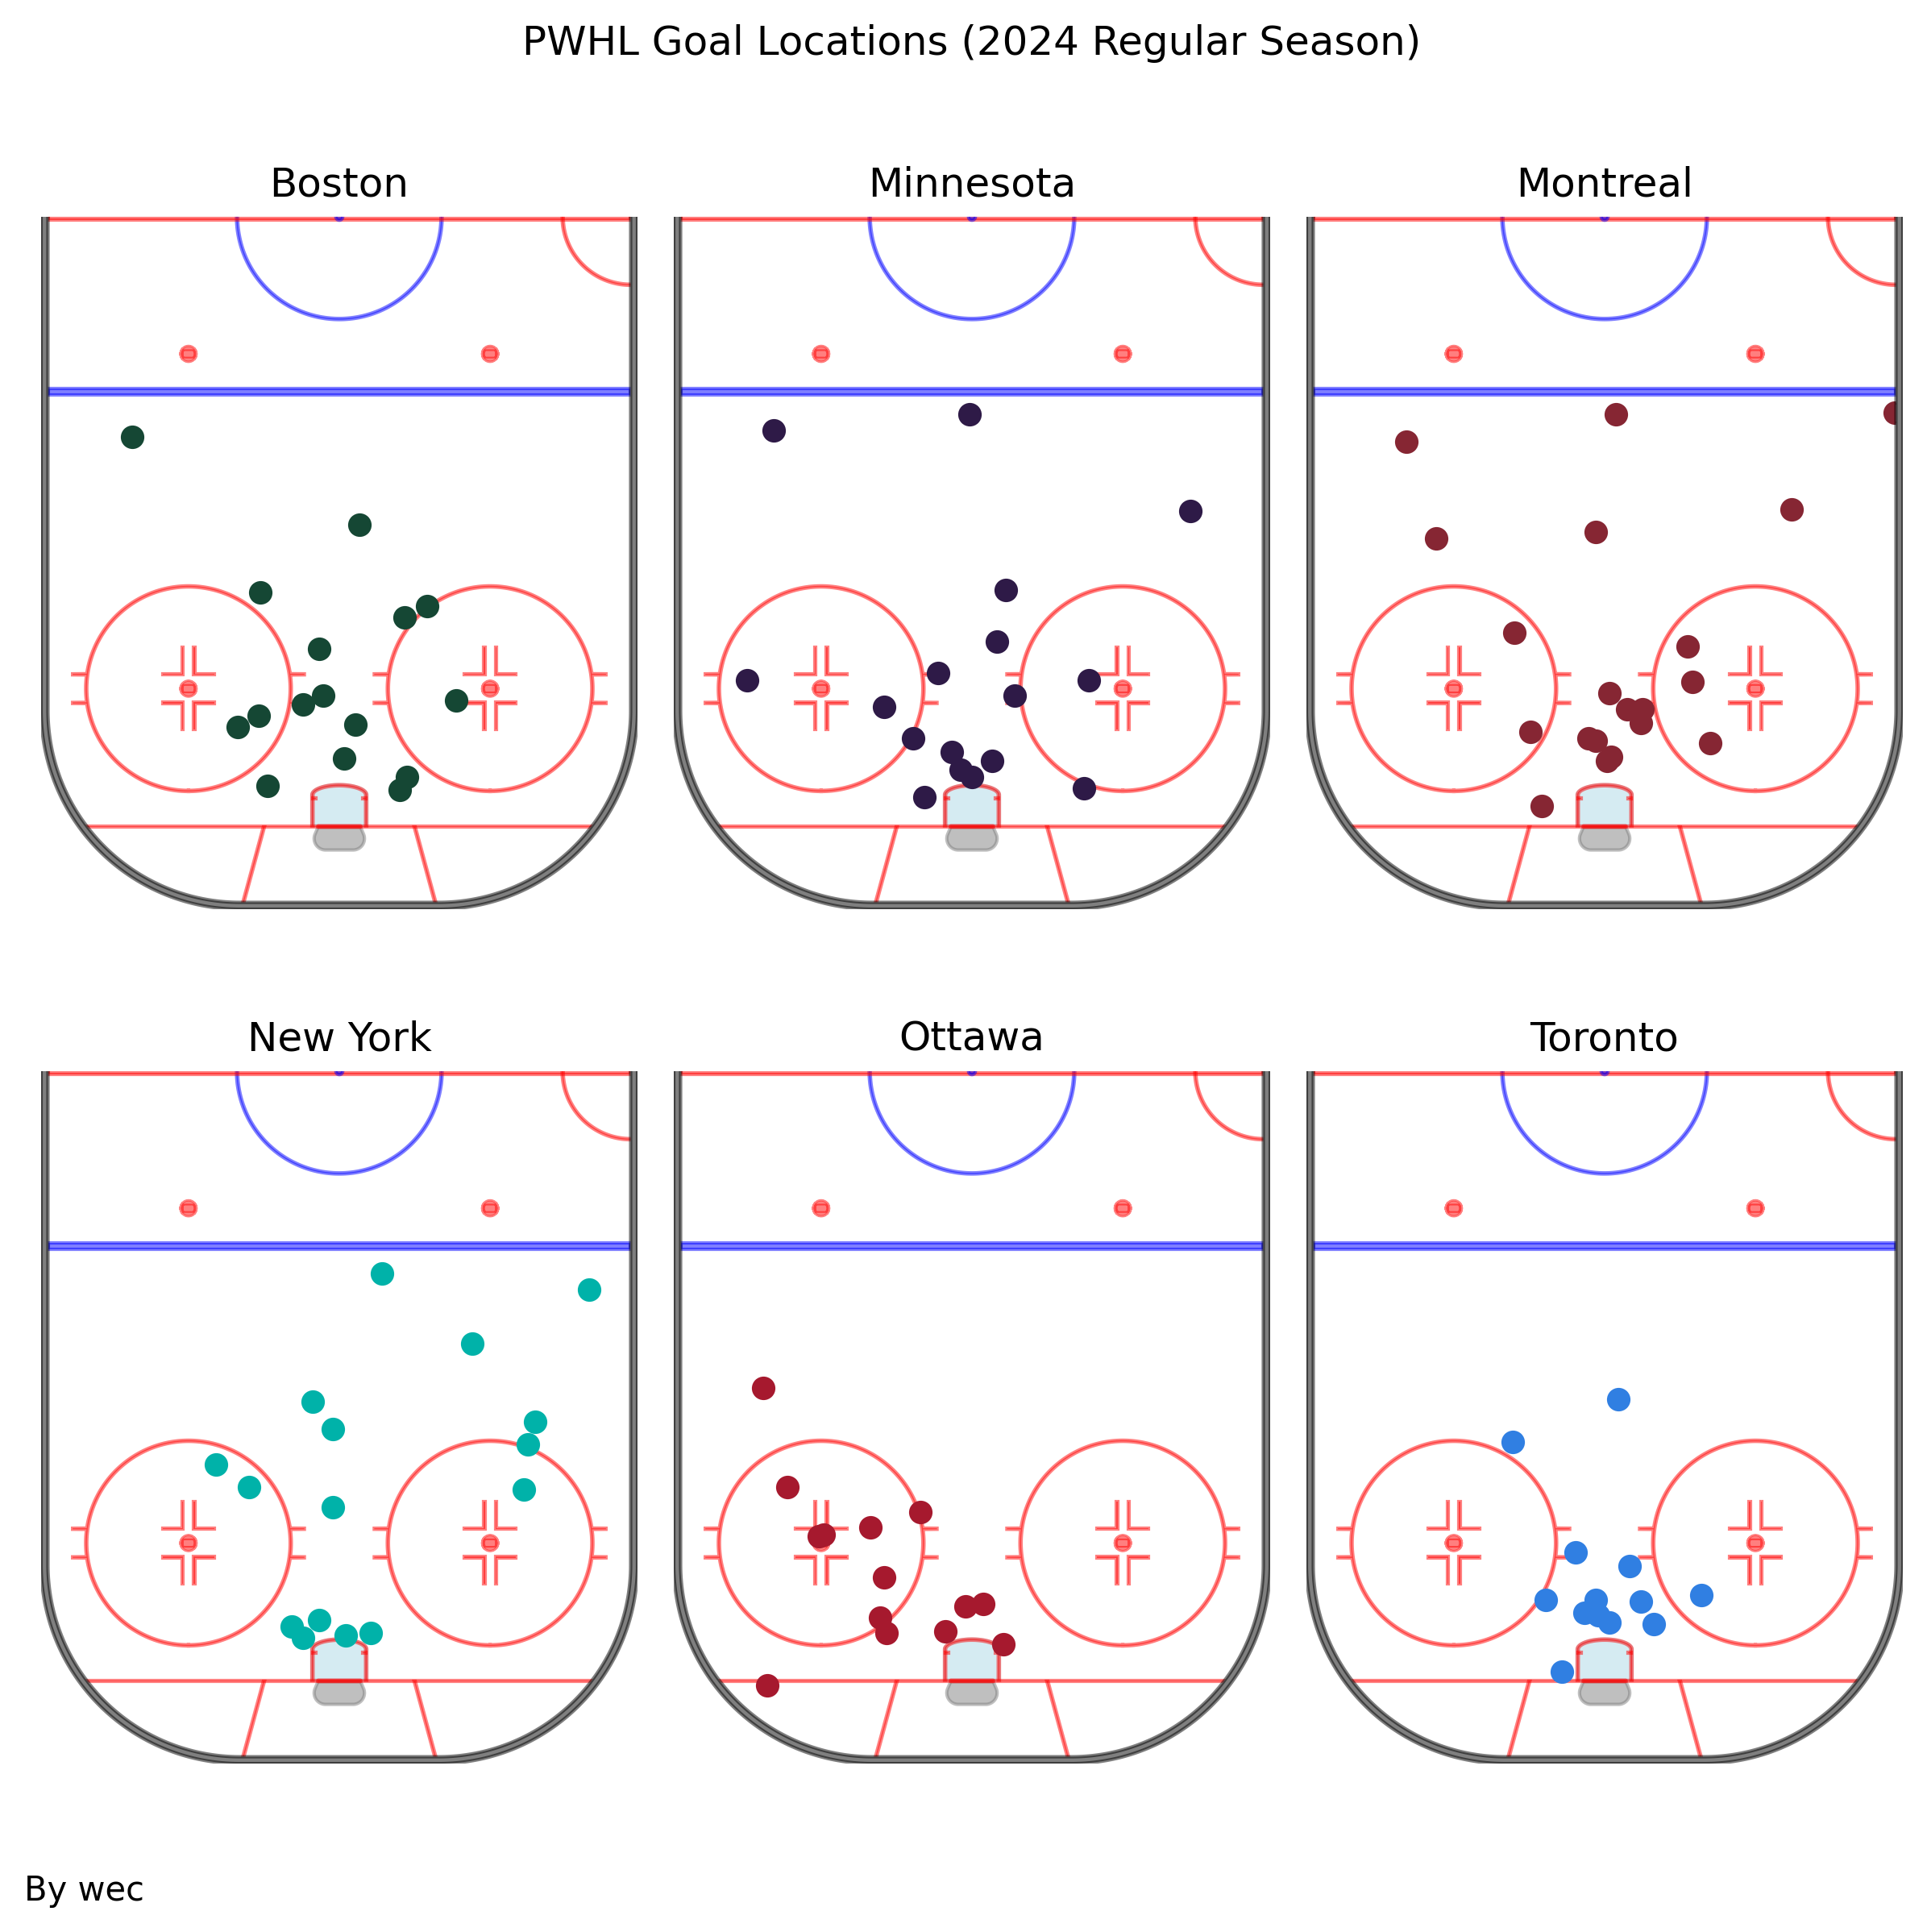
But teams are not average, they are all over the map, so let's see the map (note these charts are for the first 21 games played and do not include Minnesota's most recent outing. Shots are regulation only.)
Them
Well, they have one loss. That pretty much says it all.
Us
Toronto, as you can see by the graphics, scores from good locations, shoots more than anyone else, and has the worst goaltending.
As we've talked about before, their offence has a bit of individualism to it. The players aren't using their linemates much to get chances out of all that shooting. So it's not correct to call their SH% luck. Toronto's is at 5% now in regulation and overtime. Some of it is likely the kind of peaks or valleys you get in only seven games played.
But even with a league average SH%, Toronto would only have seven more goals and would still be at a negative goal differential, so the problem can't have just a shooting-based fix. At league average goaltending, this team is hot.
And so we've proven the adage again, that if you don't have league average goaltending, you need a plan to go get it.
Toronto has activated one new player on their roster, Victoria Bach has finished her teaching degree and is joining the team.
Lines
Lines will be added in the post or comments when they become available.


Comment Navigation & Markdown
Navigation
cc to focus on comments section
c next comment
x previous comment
z next unread comment
Inline Styles
Bold: **Text**
Italics: *Text*
Both: ***Text***
Strikethrough: ~~Text~~
Code: `Text` used as sarcasm font at PPP
Spoiler: !!Text!!