

I began messing around with the available stats from PWHL games over the last few weeks, and I wanted to start with something usually ignored on the gamesheet. It isn't about hockey as hockey, but it's about the PWHL as a league and a business.
First, what is and what is not available: The total attendance is listed on the gamesheet for each game. This is standard across most hockey leagues. The IIHF does this at championships as do the AHL, ECHL, etc. If you want to look at other leagues, Hockey DB has a lot of data charted out.
The total number of tickets offered for sale is not public in almost all cases. Ticketmaster listed the net capacity for Toronto and Ottawa, so I used those numbers, but for all the other venues, I used the public data on what a hockey game in that venue seats. This is a bit hazy because some rinks have standing room that is not always used. Using the total capacity of every building turned out to be controversial when I test marketed some of this information. More on that in a bit, but first, where are these teams playing?
Venue Capacity
| Team | Venue | Capacity |
|---|---|---|
| Ottawa | TD Place | 9,274 |
| Toronto | Mattamy Athletic Centre | 2,740 |
| Montréal | Verdun Auditorium | 4,114 |
| Montréal | Place Bell | 10,062 |
| Boston | Tsongas Center | 6,500 |
| New York | Total Mortgage Arena | 8,412 |
| New York | UBS Arena | 17,255 |
| Minnesota | Xcel Energy Center | 17,954 |
When the Toronto team plays its game in Scotiabank another 17,000+ facility will be added to the list. There is no infinite supply of arenas of every size, and while the PWHL likely did some market research, the demand in some places has been very unexpected. Ottawa originally thought they would tarp off some of the seats, and then they quickly realized they don't need to. They don't sell out every game, but they fill more than the lower bowl. More on that, but first the controversial total attendance graph.
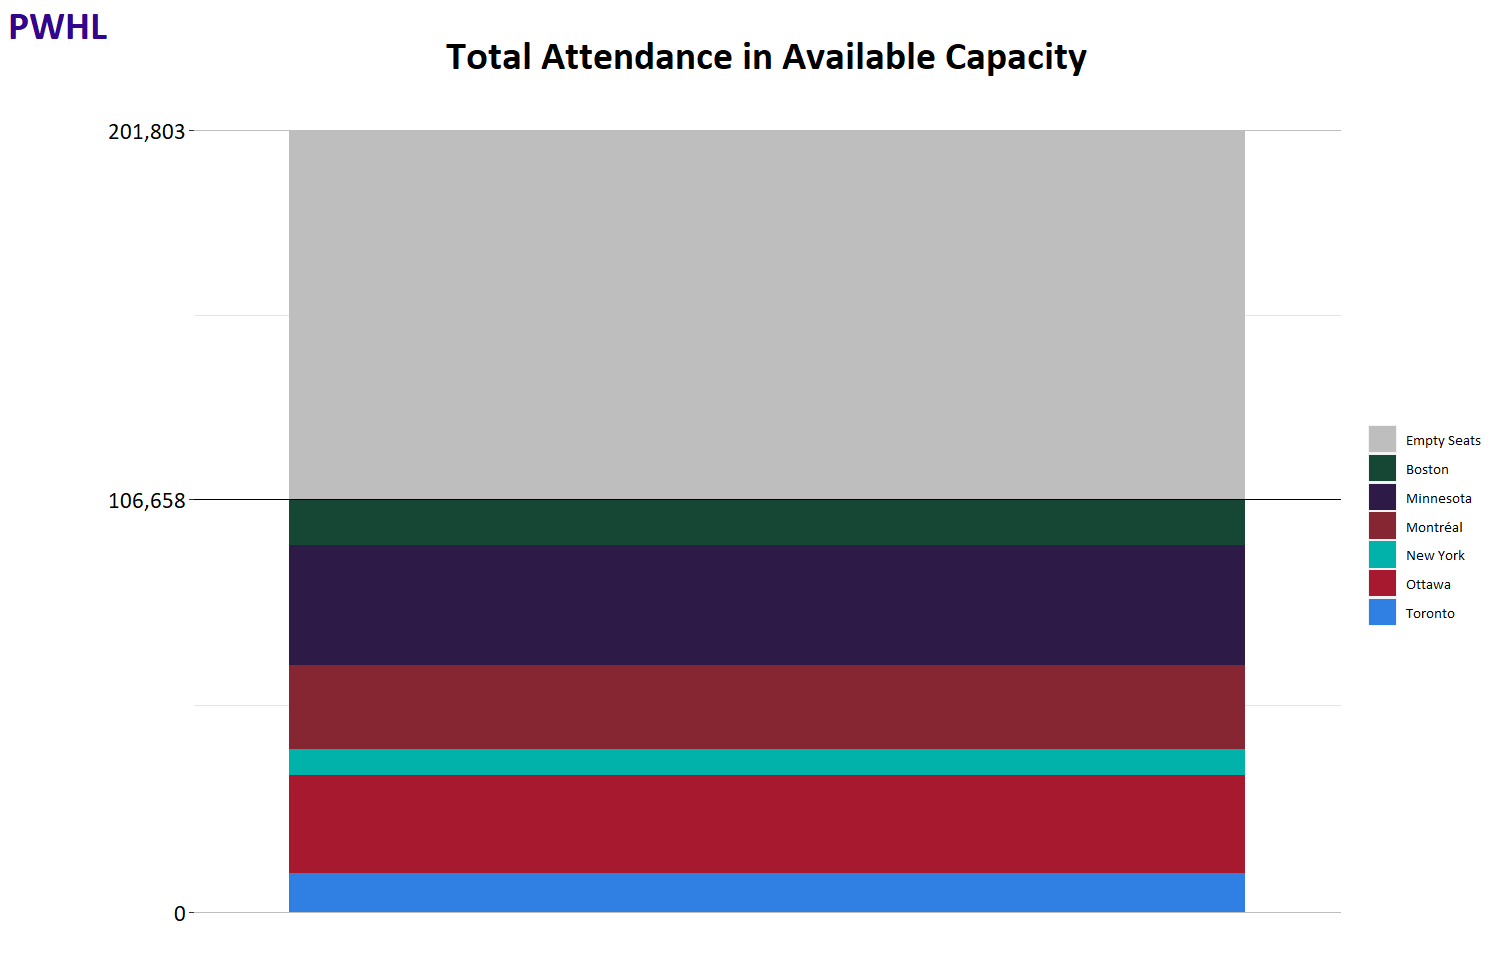
The big grey blob makes this a bad chart to use for PR. I'm not doing PR, though. But the controversy this chart raised was all about the tarps. If you look at just this information, you can skip right over the 100,000+ total attendance so far and just focus on the least interesting colour.
If I were to somehow acquire the total tickets offered for each game, I could shrink that grey blob. Except I wouldn't. Get out your tarp, and you hide the seats, you don't make them vanish. And as the Ottawa example shows, if demand rises, the tarps come down and those tickets get sold. Total capacity represents all available seats, and the total potential crowds are 200,000 so far.
Do a little multiplication if you want to imagine the general revenue from ticket sales. Tickets sell for $25 and up for most teams. Convert the 22 games to 72 if you want to see the full season of sales estimated.
Minnesota is leading the rest of the teams in terms of attendance, and the obvious context is that Minnesota is also leading the rest in empty seats. The NHL is fairly unique in hockey in having capacities of all the same size (offer not valid in Arizona). But most leagues have exactly this structure where some teams have buildings bigger than they need, and some could use the city of Toronto to build more civic infrastructure.
Onto the context for that total:
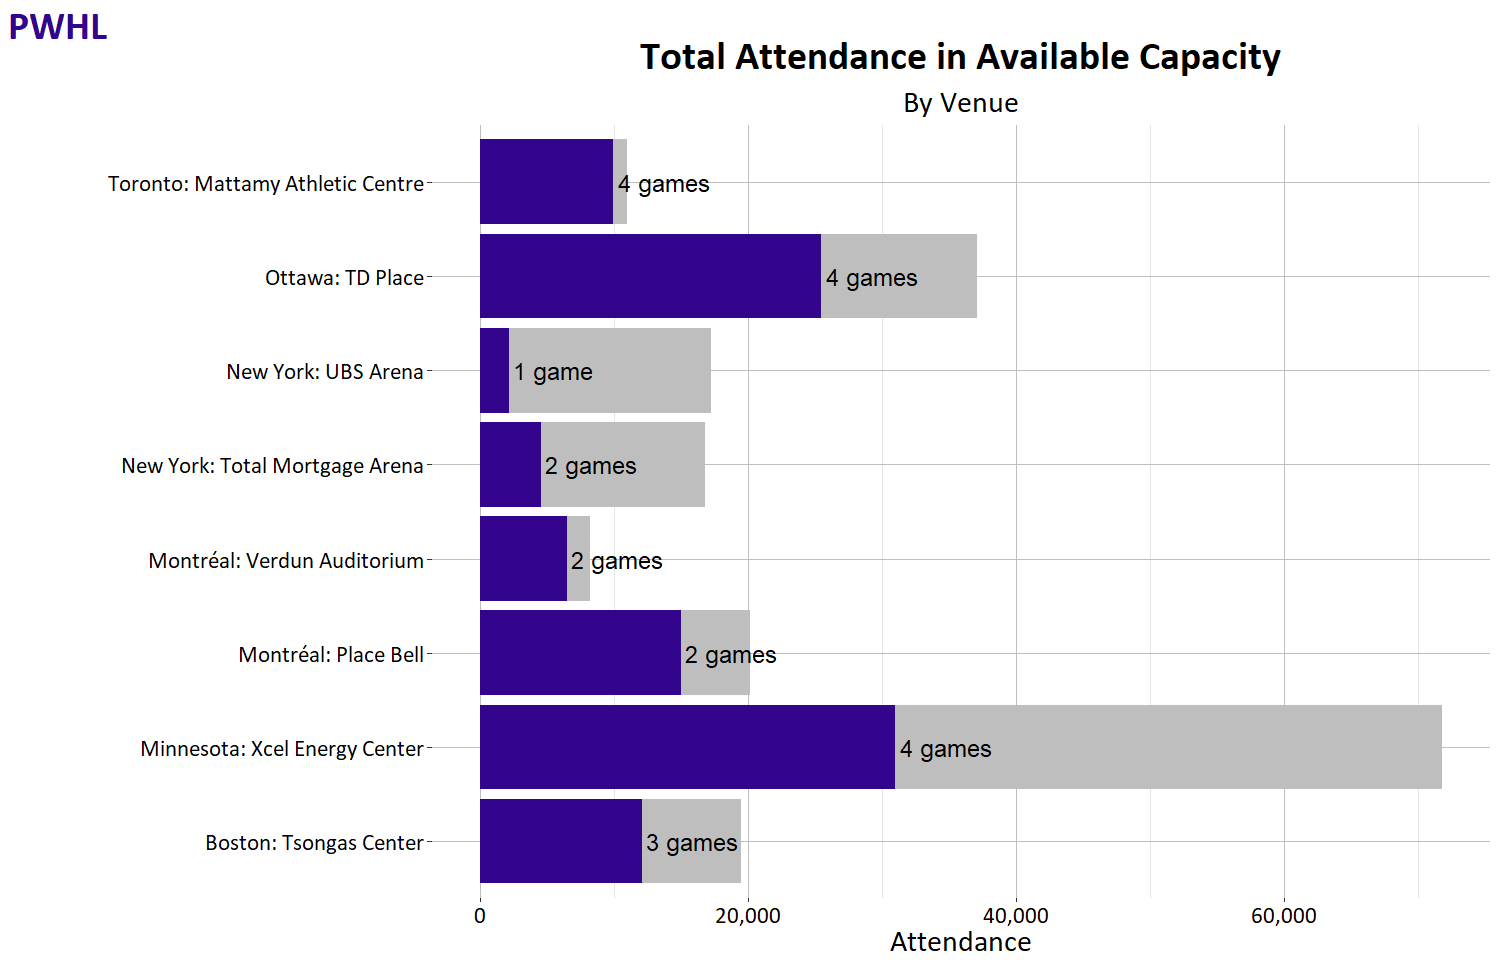
Toronto shows some very small numbers of empty seats although they are sold out entirely. When New York plays in the big rink, they don't fill it up like Minnesota does. Montréal is bringing out a lot of fans to either venue on opposite sides of the island, but they can easily fill the bigger Laval arena. Boston and Minnesota are building on the NCAA tradition in their areas.
And now the same style of graph as Hockey DB uses:
This will gain more meaning as more games are played, and it will be very interesting to see what that Scotiabank game does to the Toronto numbers. I included TD Garden on the Boston map. I don't know if Boston will play a game there, but I wouldn't be surprised if they do.
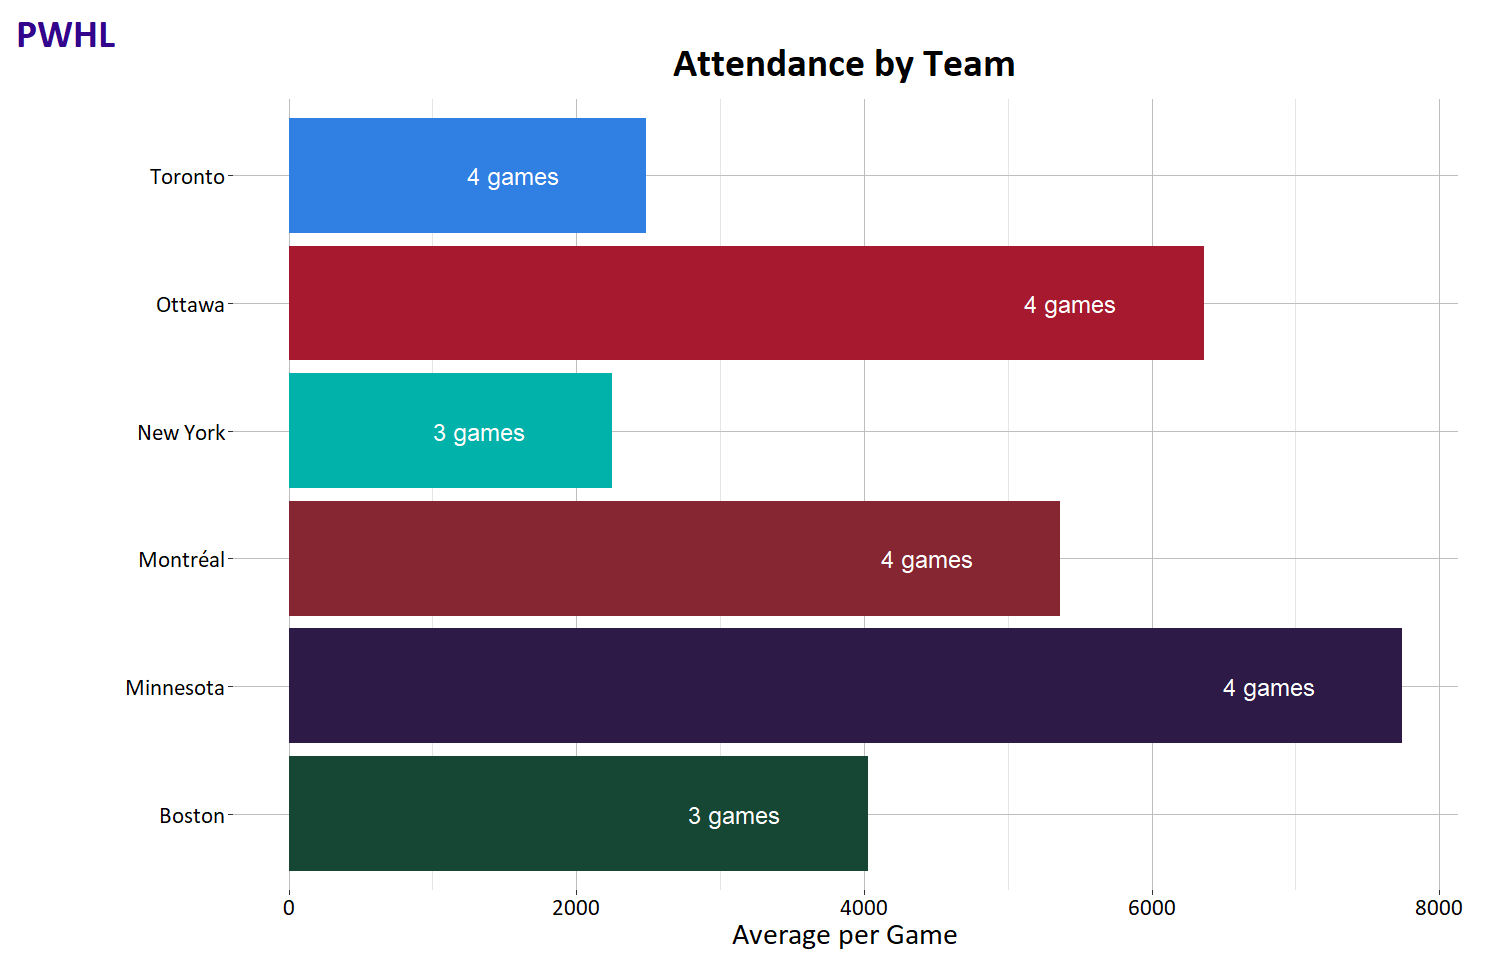
Now about New York. Total Mortgage Arena is in Connecticut, see above, and it is also the home of the Bridgeport Islanders. That link up there to Hockey DB takes you to the AHL numbers for this season. The PWHL team in that rink has seen 2,272 people per game. Their attendance in the one game at the Islanders NHL rink was very similar. The Bridgeport Islanders average 3,004 per game which is consistent across the last three years the team has played in that arena. Greater New York hasn't got the same culture of game attendance for non-NHL hockey that the other teams have.
Compare New York to Montréal where in Laval, the AHL team is at 8,858 per game and PWHL Montréal is at 7,490.
Once 36 games have been played, this will get another look. But no more talk about tarps. Every team would sell out a 17,000 seat arena if they could, but no one starts out with a league that does that. The NHL sure didn't.


Comment Navigation & Markdown
Navigation
cc to focus on comments section
c next comment
x previous comment
z next unread comment
Inline Styles
Bold: **Text**
Italics: *Text*
Both: ***Text***
Strikethrough: ~~Text~~
Code: `Text` used as sarcasm font at PPP
Spoiler: !!Text!!